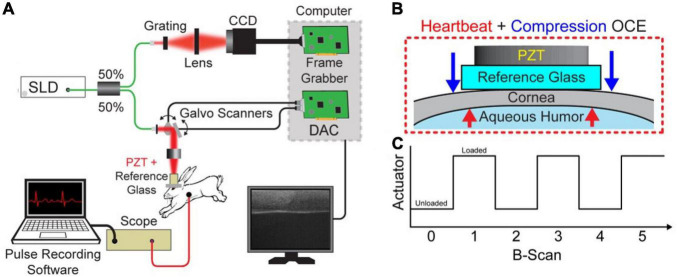
FIGURE 1.
(A) Schematic of the combined Hb+Compression OCE system. (B) Zoomed in view of the interface between the reference glass and cornea with visualization of the forces acting on the cornea. The blue arrow indicates the compression force applied by the piezoelectric transducer (PZT), and the red arrows illustrate the force applied by the hearbeat-induced ocular pulse. (C) PZT actuation as a function of image acquisition, where each B-scan took 16 ms. Hb-OCE data was acquired between two images of the same state (i.e., B-scan 0 versus B-scan 2), and compression OCE measurements were acquired between images of opposite states (i.e., B-scan 0 versus B-scan 1).

