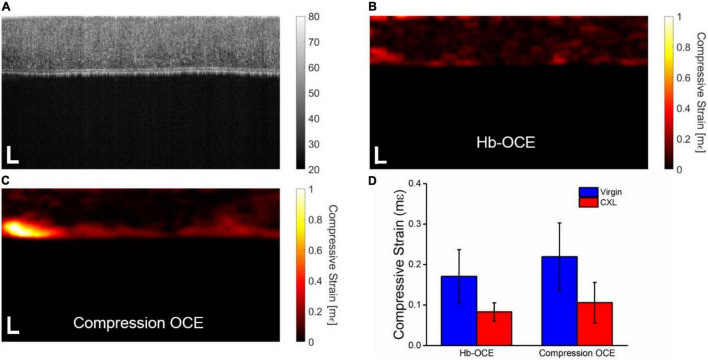
FIGURE 3.
(A) OCT intensity B-scan of the cornea in Figure 2 that has been crosslinked. Corneal stiffness mapped by (B) Hb-OCE and (C) compression OCE (D) Mean and standard deviation of virgin and crosslinked corneas measured by Hb-OCE and compression OCE. Scale bars are 100 μm.

