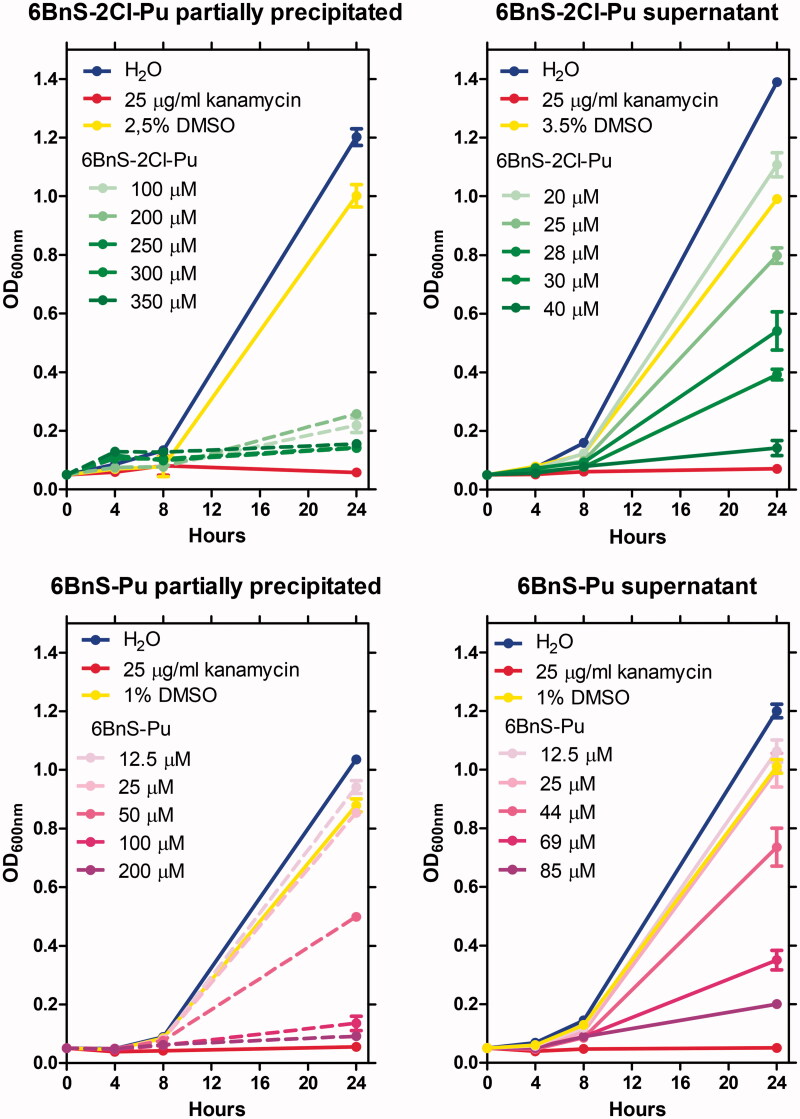
Figure 4.
Growth curves of H. pylori 26695 strain in the presence of various concentrations of 6BnS-2Cl-Pu (upper panels) and 6BnS-Pu (lower panels). Left panels – effects of partially precipitated stocks of the inhibitors, hence the actual concentration of dissolved inhibitor is lower. Right panels – effect of filtered stocks (supernatants). The effect of stocks (supernatants) of the particular tested compound (left panels), and the respective filtered solution of these stocks (right panels) are marked with the same colour, with the dashed and solid lines, respectively.

