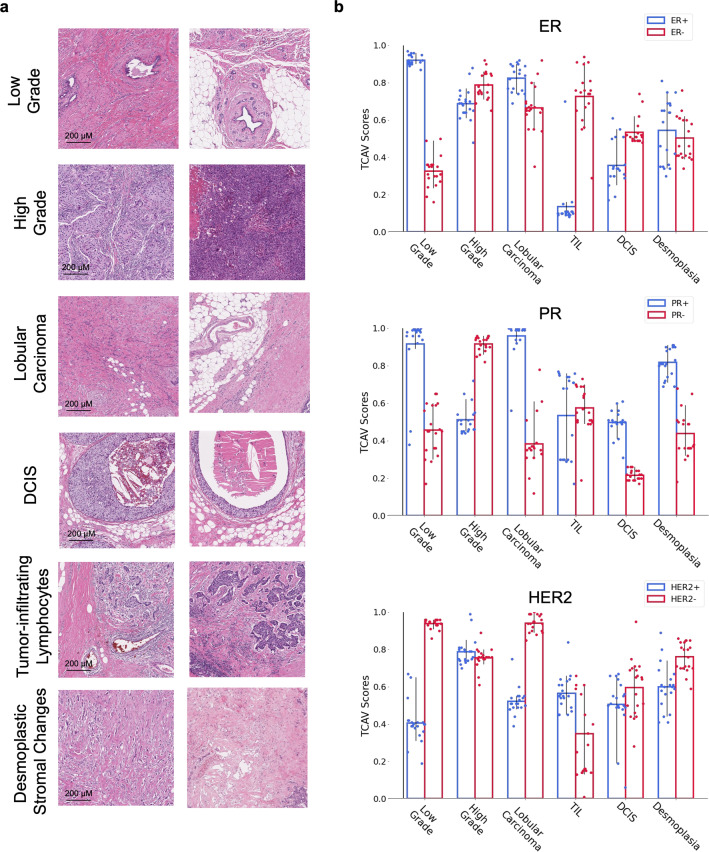
Fig. 4. Testing with Concept Activation Vector (TCAV) analysis.
a Representative concept patches for each of the six concepts used for TCAV analysis. b TCAV scores for positive (blue) and negative (red) biomarker status for each of the three biomarkers. Error bars are 95% confidence intervals over 20 trials using 500 class-of-interest patches, 500 random patches, and 100 concept patches per trial. Higher scores indicate stronger association of the concept with the model’s representation of that biomarker status. Detailed TCAV scores are provided in Supplementary Table 3 and Supplementary Data 2. TIL tumor infiltrating lymphocytes, ER Estrogen Receptor, PR Progesterone Receptor, HER2 human epidermal growth factor receptor 2, DCIS Ductal Carcinoma In Situ.

