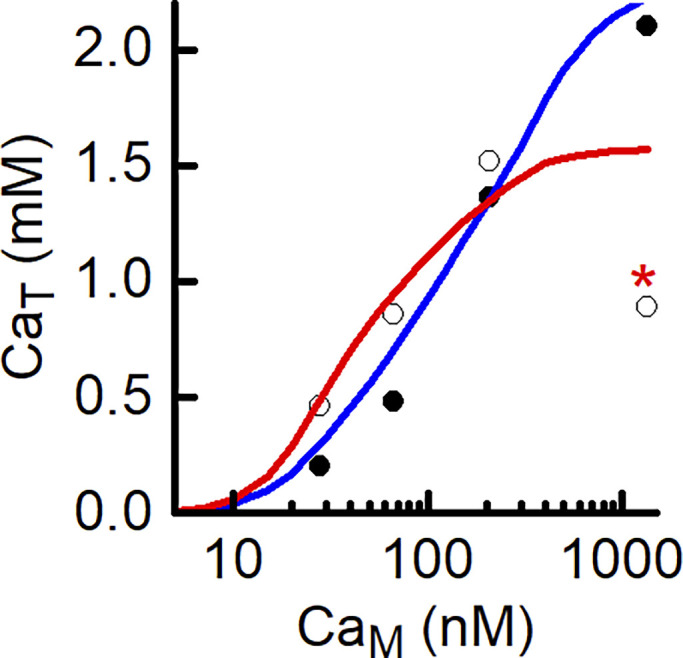
Figure 12.

Modeling MH-susceptible fibers. Experimental data (symbols: filled circles, with tetracaine; open circles, without tetracaine) from human muscle fibers containing an MH causative mutation of the RYRs. Curves (blue, with tetracaine; red, without tetracaine) show the best fit of the model to the experimental data. Note, point marked with an asterisk was omitted from the analysis (for explanation, see Results). The best-fit value of was 0.08 s−1.
