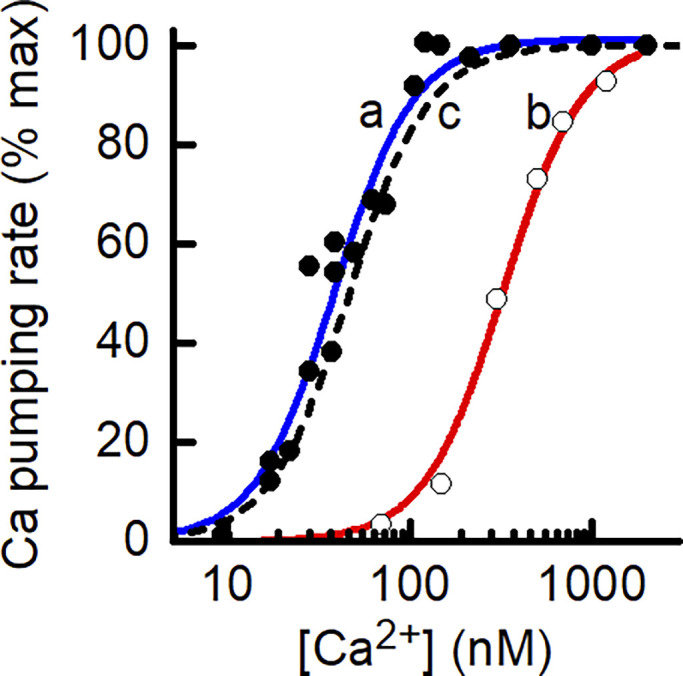
Figure 3.

Comparison of experimental and model-derived dependence of rate of PMCA Ca2+ pumping on [Ca2+]. The PMCA model can replicate published ATPase data. The symbols are experimental data relating the rate of ATP splitting by PMCA as a function of [Ca2+] for different preparations of PMCA. Kosk-Kosicka and Inesi (1985; Fig. 3; used with permission from FEBS Letters). Filled circle, solubilized, purified PMCA from human erythrocytes, Ca50, 38 nM (Enyedi et al., 1993; Fig. 5); open circle, microsomal vesicles containing a human PMCA-derived construct, Ca50, 332 nM. The curves (a [blue] and b [red]) drawn through the data are the least-squares fit of the PMCA model used in the current study to the experimental data, adjusting only the value of PMCA Ca2+ affinity. The dashed black line (c) shows the relationship used for analysis of Ca2+ leak in the skinned fiber preparation.
