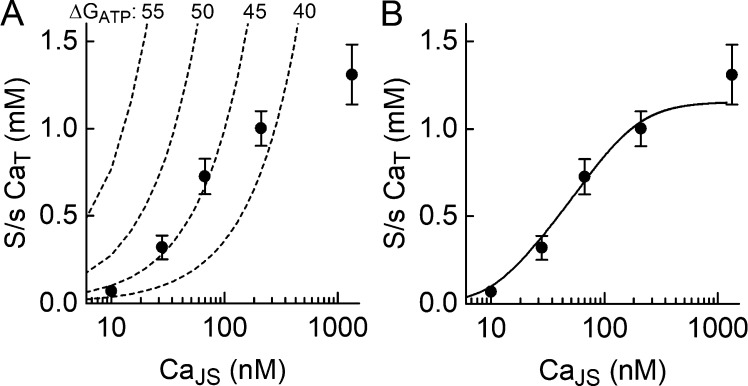
Figure 4.
Models to account for steady-state CaT. (A) Ca2+ accumulation in the t-system limited by pump thermodynamics. The dashed curves show steady-state CaT–CaJS relationships for different ΔGATP values. The curves show what steady-state CaT would be if it was determined only by the ability of the pump to generate a gradient (Eq. 5). The symbols are experimental data (mean ± SEM) determined in the presence of tetracaine; the independent variable for the experimental data was CaM, but with RYRs blocked by tetracaine, CaM ≈ CaJS, which drives the pump, both determined by the Ca2+–EGTA equilibrium. (B) Steady-state CaT determined by balance between pumping Ca2+ into the t-system and a concentration gradient–dependent leak of Ca2+ out of t-system. The model used is given by Eqs. 6 and 7. Fitted parameters: cPMCA, 60 μM; 0.023 s−1; and 223 μM.

