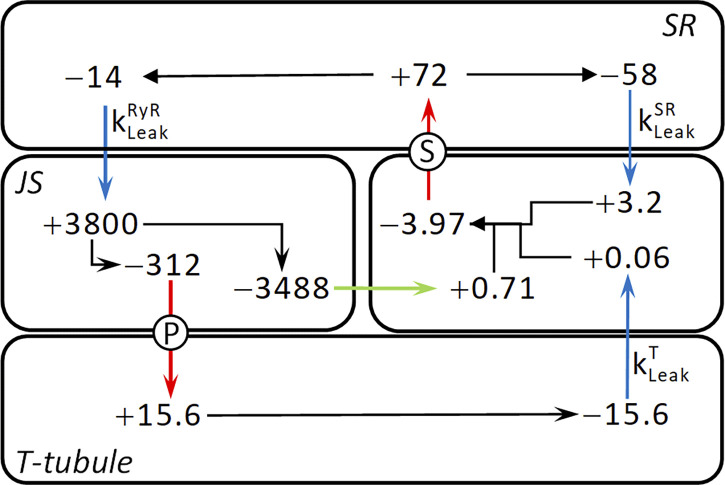
Figure 9.
Summary of steady-state Ca2+ flows. Flows of Ca2+ between compartments of the model fiber are indicated by arrows and quantified by flow rates in μM s−1. Arrow colors: blue, passive leaks; red, active pumps; green, diffusion; black, division of flows within compartments. Pumps: P, PMCA; S, SERCA. Leaks are identified by adjacent leak rate constant symbols. Rates in each compartment are expressed with concentrations relative to that compartment’s volume; −, efflux from a compartment; +, influx into a compartment. Differences in rates between the ends of arrows that span compartment boundaries reflect the difference in volumes of the two compartments. The following values were used to construct the diagram: CaSR, 400 μM; CaT, 1,200 μM; 0.013 s−1; 0.035 s−1; and 0.145 s−1.

