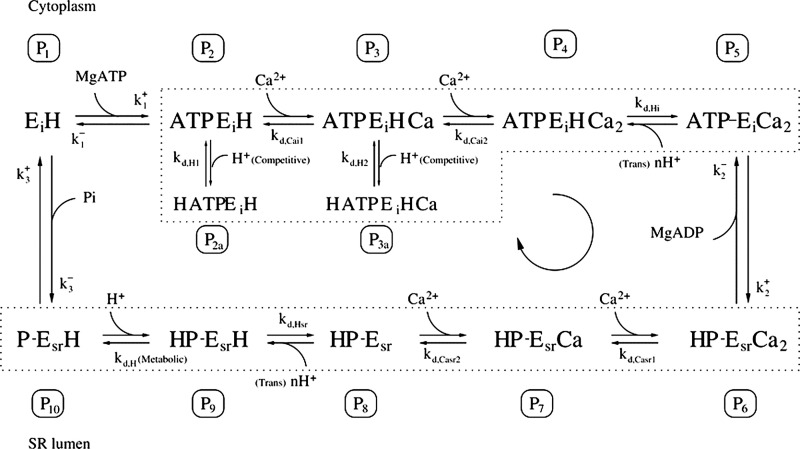
Figure A1.
Schematic of biochemical model of SERCA. The eight-state model of Ca2+ transport by SERCA described by Tran et al. (2009). This was a simplification of a 12-state model and underlies their 2-state model, as used in the current study. Rate constants are indicated by or for forward and reverse reactions, respectively, and x can be 1, 2, or 3, as shown in the figure). Dissociation constants are depicted by The figure is reproduced from Tran et al. (2009).

