Figure 5.
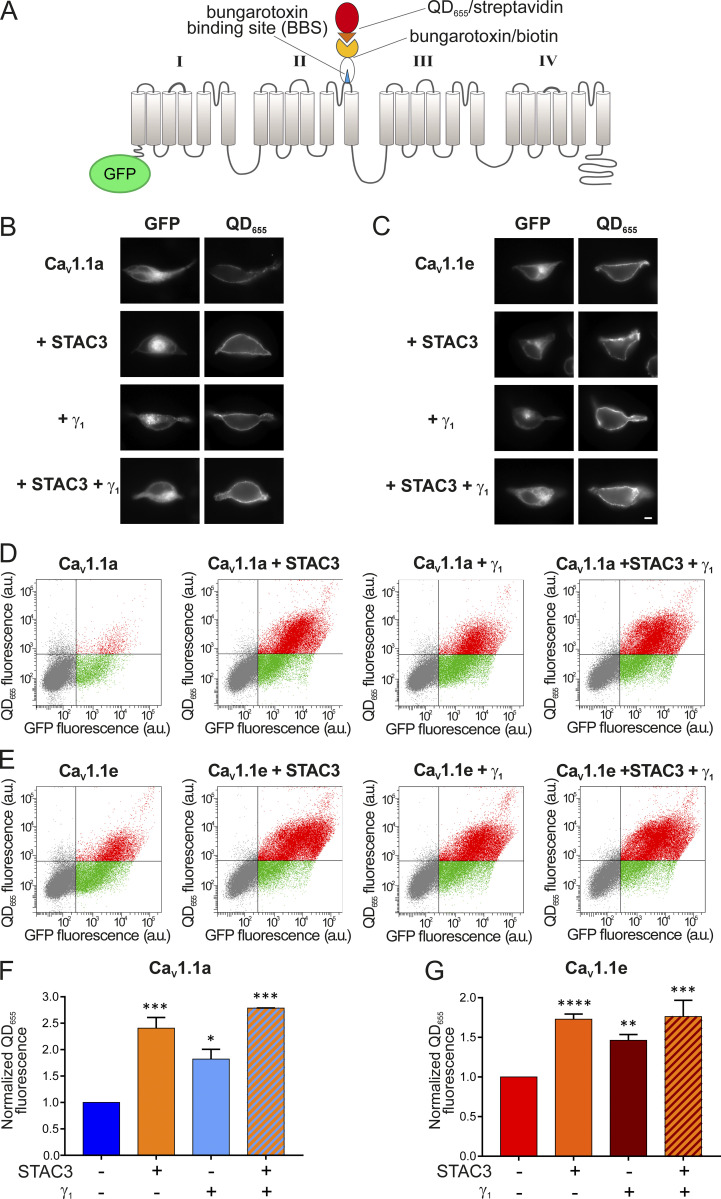
γ1 Increases the surface density of both CaV1.1a and CaV1.1e isoforms. (A) Scheme displaying the strategy to detect CaV1.1 channels expressed on the plasma membrane of HEK cells (stably expressing β3 and α2δ-1). The introduction of the 13 amino acid BBS in the extracellular domain of GFP-CaV1.1a or GFP-CaV1.1e allowed the selective labeling of channels in the membrane by sequentially incubating the unpermeabilized cells with biotinylated BTX and streptavidin-conjugated quantum dots (QD655). (B) From top to bottom, representative images of HEK cells expressing the adult GFP-CaV1.1a isoform alone, with STAC3, with γ1, and with both STAC3 and γ1. (C) The same for HEK cells expressing the embryonic GFP-CaV1.1e isoform. Scale bar, 2 µm. (D and E) Representative raw data from flow cytometry experiments showing the GFP and the QD655 signal for cells expressing GFP-CaV1.1a (D) or GFP-CaV1.1e (E) alone, with STAC3, with γ1, and with both STAC3 and γ1. The vertical and horizontal lines represent threshold values determined using untransfected cells, untreated cells, and cells exposed only to QD655. Single cells are depicted as dots, which have been colored in gray (untransfected), green (transfected, lacking surface expression), or red (transfected with appreciable surface expression). (F and G) Normalized mean QD655 fluorescence signals across separate flow cytometry experiments (n = 4). Data were normalized to the QD655 signals of cells expressing only GFP-CaV1.1. In F, the conditions with STAC3 (***, P = 0.0003), γ1 (*, P = 0.0143), and STAC3 + γ1 (***, P = 0.0002) are significantly different from the control GFP-CaV1.1a using one-way ANOVA and Tukey post-hoc mean comparison. In G, the conditions with STAC3 (****, P < 0.0001), γ1 (**, P = 0.0019), and STAC3 + γ1 (***, P = 0.0002) are significantly different from the control GFP-CaV1.1e using one-way ANOVA and Tukey post hoc mean comparison.

