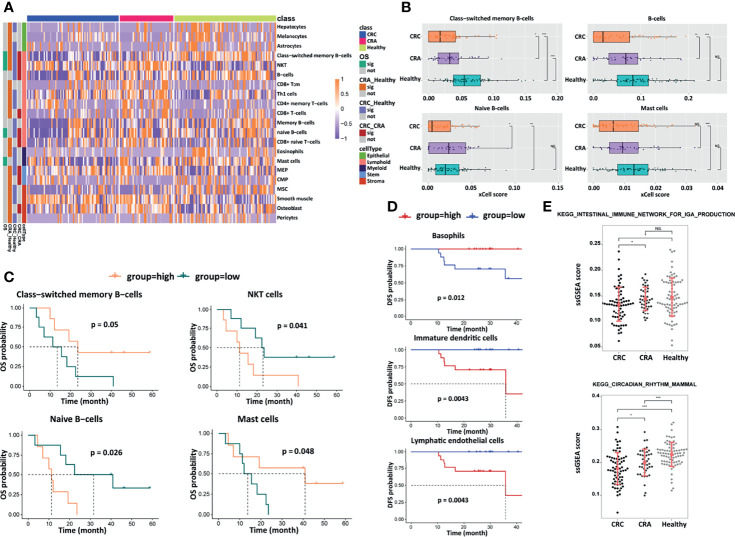
Figure 5.
Analyses of cell components, survival, and signaling pathways. (A) Heatmap of unsupervised hierarchical clustering of the 21 cell types in different groups. (B) Box plots of selected cell-type abundance between CRC, CRA, and healthy groups. Prognostic significance of selected cell types by (C) OS and (D) DFS. (E) ssGSEA score and statistical significance for selected KEGG pathways differing between CRC, CRA, and healthy groups. ***p < 0.001; **p < 0.01; *p < 0.05; NS, not significant.

