
Figure 1.
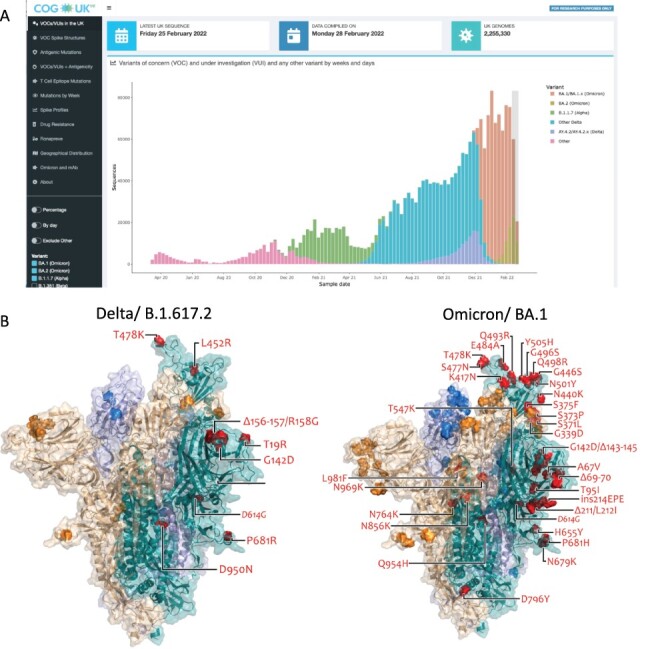
(A) Frequency plot showing the number of SARS-CoV-2 sequences per week for VOCs Alpha, Delta, Delta-AY4.2, Omicron BA.1 and BA.2, and ‘other’ pre-VOC variants (see key) in the UK. The light grey box covering the two most recent weeks indicates a period in which sequence counts are low due to a lag (Figure S1). (B) Spike protein structure showing locations of Delta- and Omicron-specific spike mutations. Ectodomain of the spike homotrimer in open conformation with individual spike protein chains shown in different colours. On each monomer, highlighted spheres show the locations of amino acid substitutions, deletions (Δ), or insertions (ins) that distinguish the Omicron (BA.1) variant, relative to the original genotype (Wuhan-Hu-1). These are annotated on the monomer with an ‘up’ receptor-binding domain where they are highlighted in red on teal. The substitution D614G, which is shared by common descent by all lineage B.1 descendants is italicised. The visualisation is made using a complete spike model (Woo et al. 2020), which is in turn based upon a partial cryo-EM structure (RCSB Protein Data Bank (PDB) ID: 6VSB (Wrapp et al. 2020)).