
Figure 2.
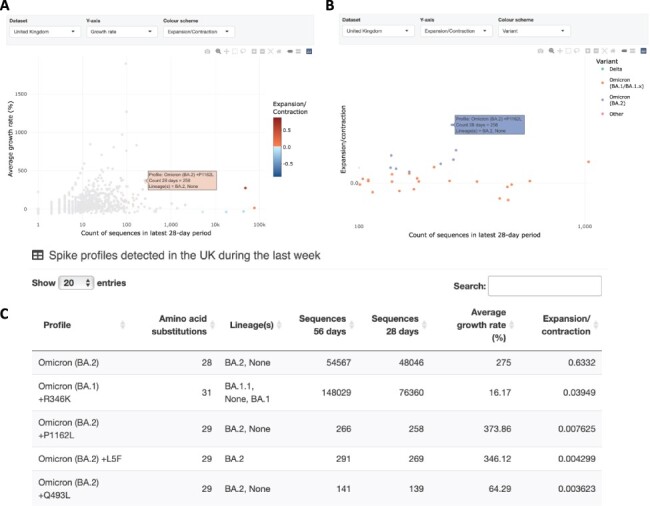
Spike profiles sampled within 7 days of the latest UK sequence are summarised. Each spike profile is a set of amino acid substitutions listed relative to the original genotype (Wuhan-Hu-1). Figure prepared with data compiled on 27 February 2022 with a most recent sequence date of 24 February 2022. A) Points represent spike profiles positioned by the number of sequences in the latest 28-day period and the average growth rate calculated over the latest 56-day period. Points are coloured by an expansion/contraction statistic that takes both the rate of change in frequency and the overall frequencies of a profile into account. The cursor is hovering to show information associated with BA.2 + P1162L. B) Points represent spike profiles positioned by the number of sequences in the latest 28-day period and the expansion/contraction statistic used to colour points in A. Here, points are coloured to show profiles associated with Delta, Omicron (BA.1/BA.1.x), and Omicron (BA.2) variants. The cursor is again positioned to highlight the position of BA.2 + P1162L. The plot has been zoomed to focus on profiles with 28-day counts between 100 and 1,000. C) Searchable table sorted to show the four profiles in the UK with the highest values in the expansion/contraction column. Further columns show profile numbers in the latest 28- and 56-day periods and average growth rate.