
Figure 5.
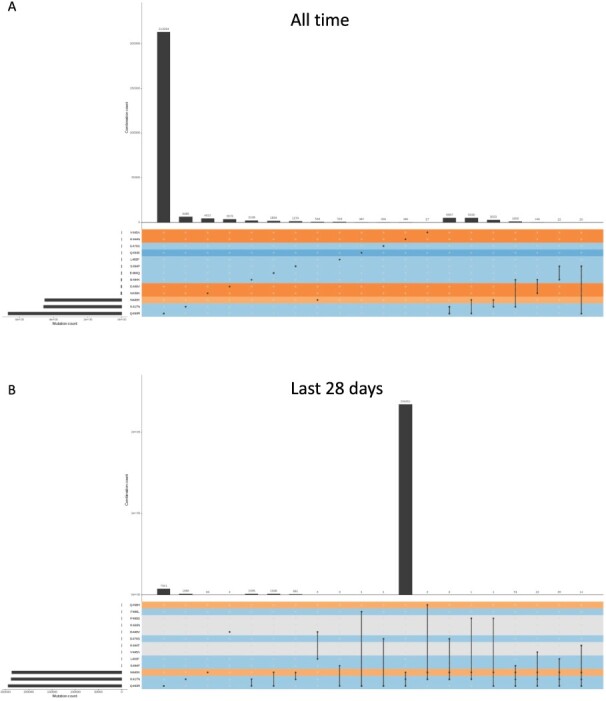
UpSet plot showing the counts of mutations affecting Ronapreve constituent mAbs that have occurred individually and in combinations (Lex et al. 2014). Occurrence is shown in the full UK SARS-CoV-2 genome sequence dataset (A) and in a dataset compiled of sequences in the latest 28-day period (B). Spike amino acid substitutions known to affect either casirivimab or imdevimab mAbs were considered. The upper histogram shows the number of sequences per mutation (dots) or combination of mutations (lines), and the bottom left histogram presents the number of sequences with each specific substitution. Rows are coloured according to the mAb to which the greatest fold decrease in binding was recorded (blue = casirivimab, orange = imdevimab), with a lighter shade indicating a fold decrease of less than 100 and darker shade indicating 100 or greater.