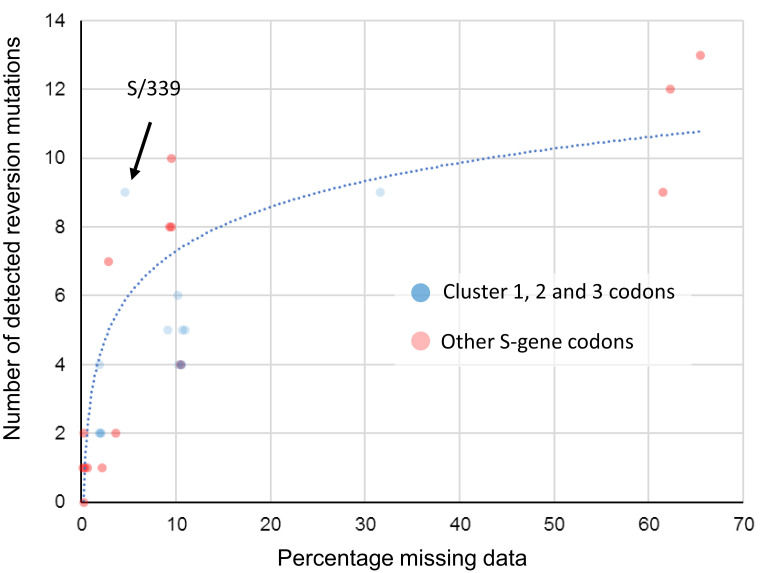
Fig. 10.
Association between the proportion of sequences with missing data at a BA.1 mutation site and the number of reversion mutations seen at that site. This significant association between missing data and reversion mutation counts (dotted blue trendline with Pearson’s R2 = 0.773; P < 0.01) is likely attributable to miscalled nucleotides at BA.1 mutation sites whenever read coverage is low during sequencing. Under conditions when PCR/sequencing primers are not optimal for the amplification of BA.1 sequence, non-BA.1 SARS-CoV-2 genetic material contaminating sequencing instruments and other laboratory equipment used for sample preparation will occasionally yield more amplions/sequence reads than those from the intended BA.1 target sequences. Wherever the nucleotide states of these contaminant amplicons are different from those of the intended BA.1 target, they will frequently yield base miscalls during sequence assembly that, if the miscalled base corresponds with an ancestral state, will be misinterpreted as reversion mutations. Compared to BA.1 lineage-defining mutations in the S-gene at codon sites that are positively selected (red dots), the 13 mutations at negatively selected or neutrally evolving cluster region 1, 2, and 3 sites (blue dots) actually have a lower than average number of detectable reversion mutations (note how the blue dots predominantly fall below the blue trend line). Only one of these 13 mutations (at codon S/339) has a number of reversions that might be higher than expected given the percentage missing data for the codons where the mutations occur.

