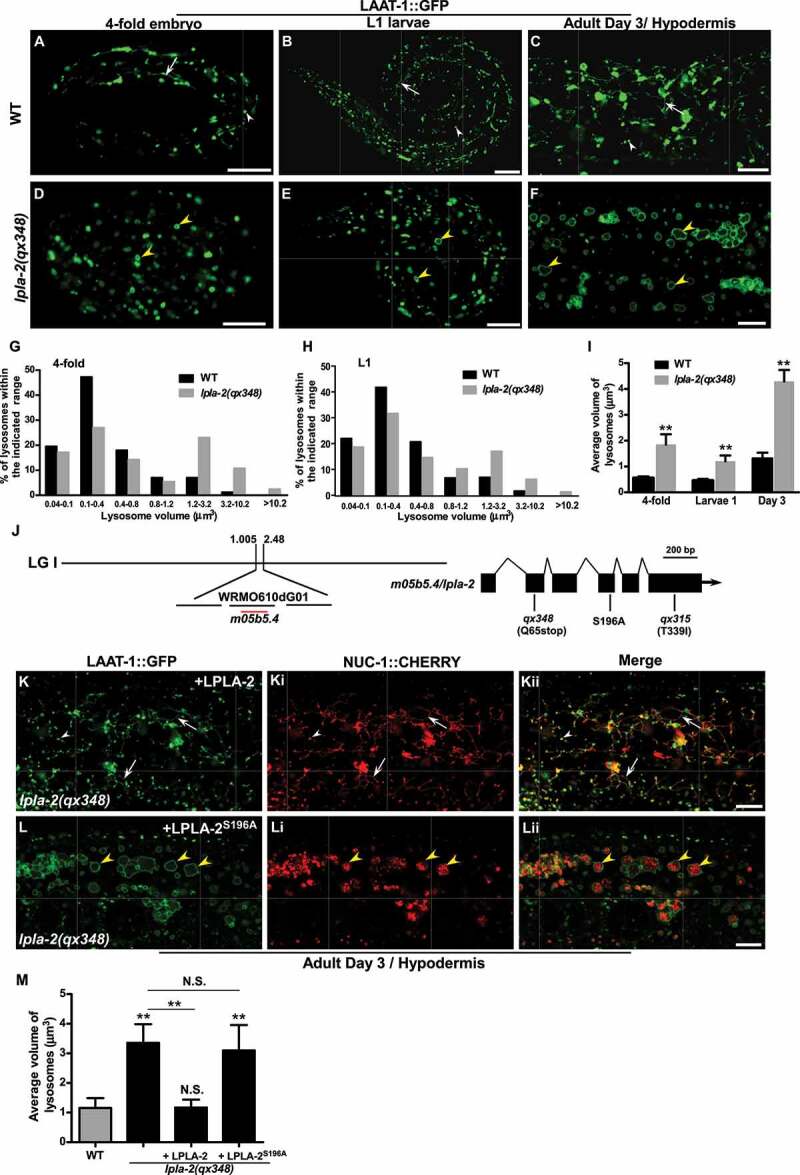
Figure 1.

lpla-2 mutants accumulate enlarged lysosomes. (A-F) Confocal fluorescence images of 4-fold embryos (A and D), L1 larvae (B and E) and adult hypodermis (C and F) in wild type (A-C) and lpla-2(qx348) (D-F) expressing LAAT-1::GFP. (G-I) Quantification of lysosome volume in 4-fold embryos, L1 larvae (L1) and adult worms at day 3. (J) Cloning of lpla-2. The left bar indicates the genetic position of lpla-2. The lpla-2 gene structure is shown at the right with filled boxes representing exons and thin lines indicating introns. The mutation sites identified in the two lpla-2 alleles, qx348 and qx315, and the one that affects the serine residue essential for the catalytic activity of the enzyme are indicated. (K-Lii) Confocal fluorescence images of the hypodermis in lpla-2(qx348) adults carrying LAAT-1::GFP and NUC-1::CHERRY, with expression of wild-type LPLA-2 (K-Kii) or LPLA-2S196A (L-Lii). Quantification of the average volume of lysosomes is shown in (M). In (A-F and K-Lii), arrows indicate tubular lysosomal structures. White and yellow arrowheads indicate normal and enlarged globular lysosomes, respectively. In (I and M), at least 10 animals were scored in each strain at each stage, and data are shown as mean ± SD. One-way ANOVA with Tukey’s post hoc test (M) or two-way ANOVA with the Bonferroni post hoc test (I) was performed to compare mutant datasets with wild type or datasets that are linked by lines. **P < 0.001 (I), **P < 0.0001 (M), N.S.: no significance. Scale bars: 10 µm.
