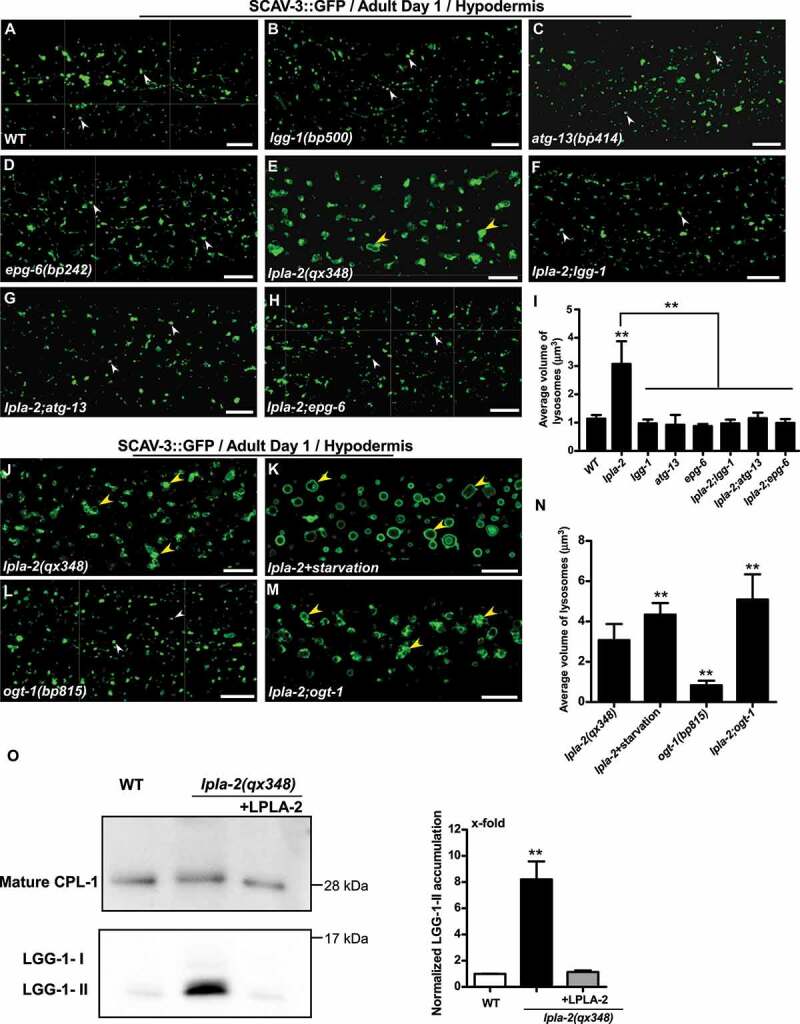
Figure 3.

Blocking autophagy suppresses lysosome enlargement in lpla-2 mutants. (A-H and J-M) Confocal fluorescence images of the hypodermis in the indicated strains expressing SCAV-3::GFP. White and yellow arrowheads indicate normal and enlarged vesicular lysosomes, respectively. (I and N) Quantification of lysosome volume. At least 10 animals were scored in each strain. (O) Western blot analysis of LGG-1 accumulation in purified lysosomes from the indicated strains. Fully processed mature CPL-1 (CathePsin L family) was used to normalize the lysosome amount in each strain. LGG-1 accumulation was quantified and normalized to 1-fold in wild type (right panel). At least three independent experiments were performed. In (I, N and O), data are shown as mean ± SD. One-way ANOVA with Tukey’s post hoc test was performed to compare mutant datasets with wild type or datasets that are linked by lines. **P < 0.0001. All other points had P > 0.05. Scale bars: 10 µm.
