Figure 3.

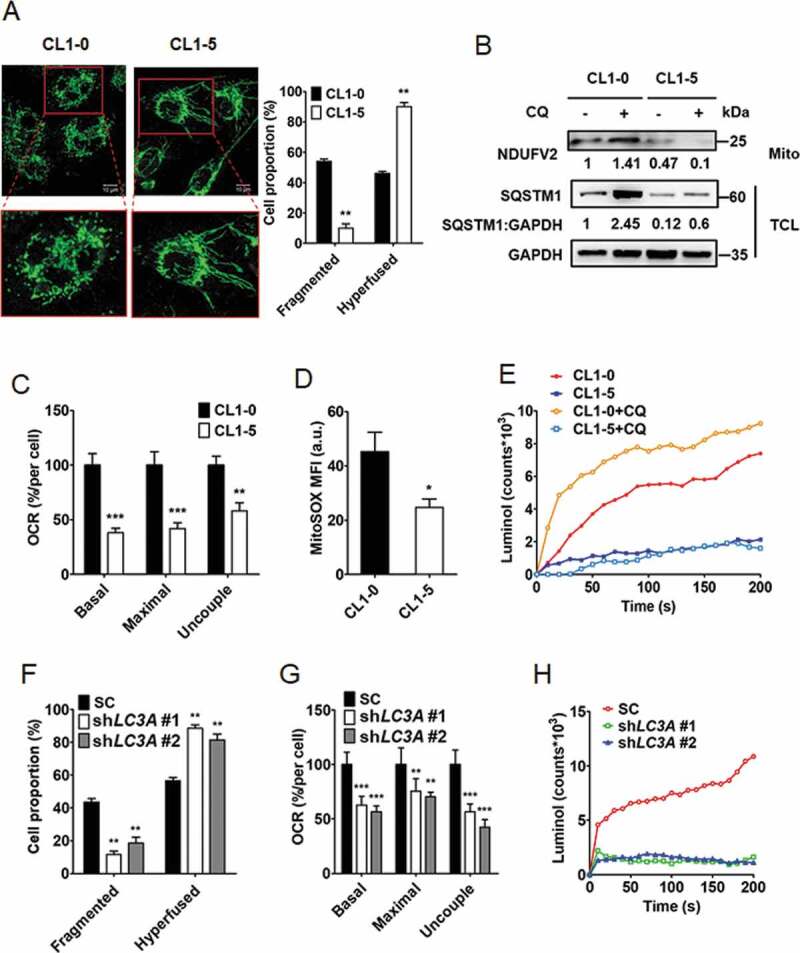
Autophagy regulates mitochondrial dynamics and degradation as well as ROS production. (A) Representative confocal fluorescence images of mitochondrial morphology in CL1-0 (fragmented, left) and CL1-5 (hyperfused, right) cells stained with mitochondrial marker TOMM20. Scale bar: 10 μm. Proportions of mitochondrial phenotypes (fragmented and hyperfused) were quantified. **p < 0.01. (B) Immunoblotting analysis to assess NDUFV2 expression from mitochondria fraction (Mito) and SQSTM1 and GAPDH expression from total cell lysate (TCL) of CL1-0 and CL1-5 cells treated with or without chloroquine (CQ, 30 μM) for 24 h. (C) OCR analysis of CL1-0 and CL1-5 cells. **p < 0.01, ***p < 0.001. (D) MitoSOX flow cytometry analysis to detect ROS levels in CL1-0 and CL1-5 cells treated with or without chloroquine (CQ, 12.5 μM) for 24 h. *p < 0.05. (E) Luminol chemiluminescence analysis to assess ROS levels in CL1-0 and CL1-5 cells treated with or without chloroquine (CQ, 12.5 μM) for 24 h. (F) Quantitative analysis of mitochondrial morphologies in CL1-0 cells transduced with the lentiviral vector encoding shLC3A or scrambled control (SC) for 14 days. **p < 0.01. (G) OCR analysis of CL1-0 cells transduced with the lentiviral vector encoding shLC3A or scrambled control (SC) for 14 days. **p < 0.01, ***p < 0.001. (H) Luminol chemiluminescence analysis of CL1-0 cells transduced with the lentiviral vector encoding shLC3A or scrambled control (SC) for 14 days.
