Figure 6.

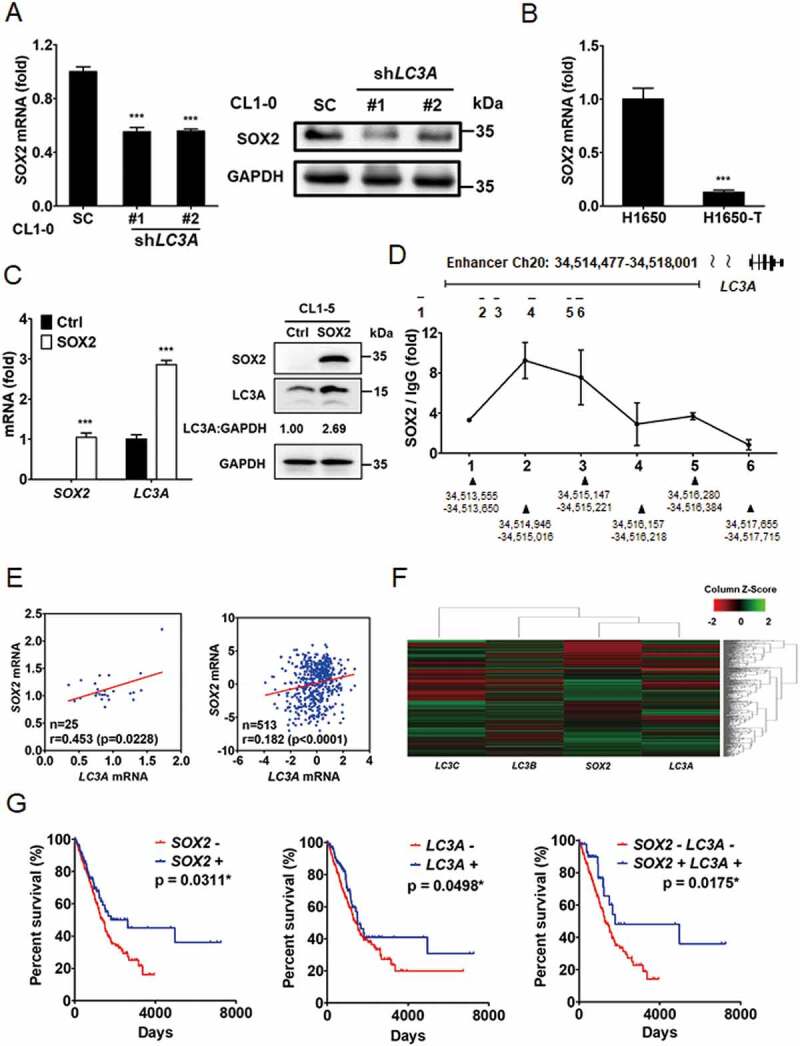
SOX2 regulates LC3A in lung cancer cells and predicts patient prognosis in lung adenocarcinoma. (A) RT-qPCR (left) and immunoblotting (right) assays to assess SOX2 and GAPDH expression in CL1-0 cells transduced with the lentiviral vector encoding shLC3A or scrambled control (SC). ***p < 0.001. (B) RT-qPCR to assess SOX2 expression in H1650 versus H1650-T cells. ***p < 0.001. (C) RT-qPCR (left) and immunoblotting (right) assays to assess SOX2 and LC3A expression in CL1-5 cells transduced with the lentiviral vector encoding SOX2 cDNA (SOX2) or empty control (Ctrl). ***p < 0.001. (D) ChIP-qPCR analysis to access the occupancy of SOX2 at the indicated regions (1–6) along the LC3A enhancer (Chr20: 34,514,477–34,518,001) in CL1-0 cells. (E) Scatter plots of correlation between SOX2 and LC3A expression in primary lung adenocarcinoma from GSE27262 (left) and TCGA-LUAD (right), displaying positive correlations between SOX2 and LC3A. (F) Hierarchical clustering analysis of SOX2, LC3A, LC3B, and LC3C expression in primary lung adenocarcinoma from TCGA-LUAD (N = 514). (G) Kaplan–Meier analysis to assess the correlation of SOX2 (left) and LC3A (middle) expression with the overall survival of lung adenocarcinoma patients (N = 500) from TCGA-LUAD cohort. The overall survival analysis was further stratified by SOX2-high/LC3A-high and SOX2-low/LC3A-low signatures (right) for Kaplan–Meier analysis (N = 325). Different groups were compared using log-rank test. *p < 0.05.
