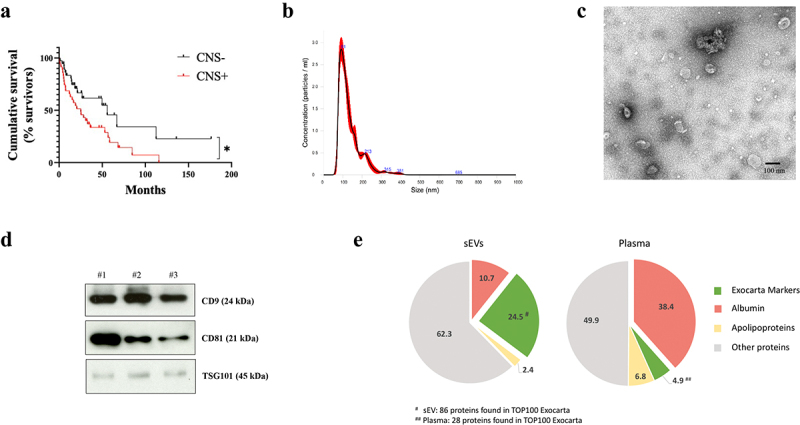
Figure 1.

Overall survival analysis of patients included in the study and characterization of plasma-circulating sEVs. a. Survival analysis and graphical representation using Kaplan-Meier curves showing the cumulative survival probability in the study population according to the absence (CNS-) or presence (CNS+) of central nervous system (CNS) metastases. * p value 0.02. Differences were assessed using the Log-Rank test. b. Representative image of the particle content (x108) by NTA analysis of a plasma sample from a melanoma patient. c. Representative electron microscopy imaging of sEVs from the same patient´s plasma. d. Representative Western blot of the analysis of exosome markers CD9, CD81, TSG101 and in sEVs isolated from the plasma of three different melanoma patients. Ponceau staining was used as loading control (see Supplementary Figure 4A). e. Proteomic analysis of sEVs and plasma paired samples derived from melanoma patients. Venn diagrams showing an enrichment of Exocarta markers (green) and a reduction albumin and apoliproteins (red) in sEVs (left diagram) compared to proteins detected in plasma samples (right diagram).
