
Figure 5.
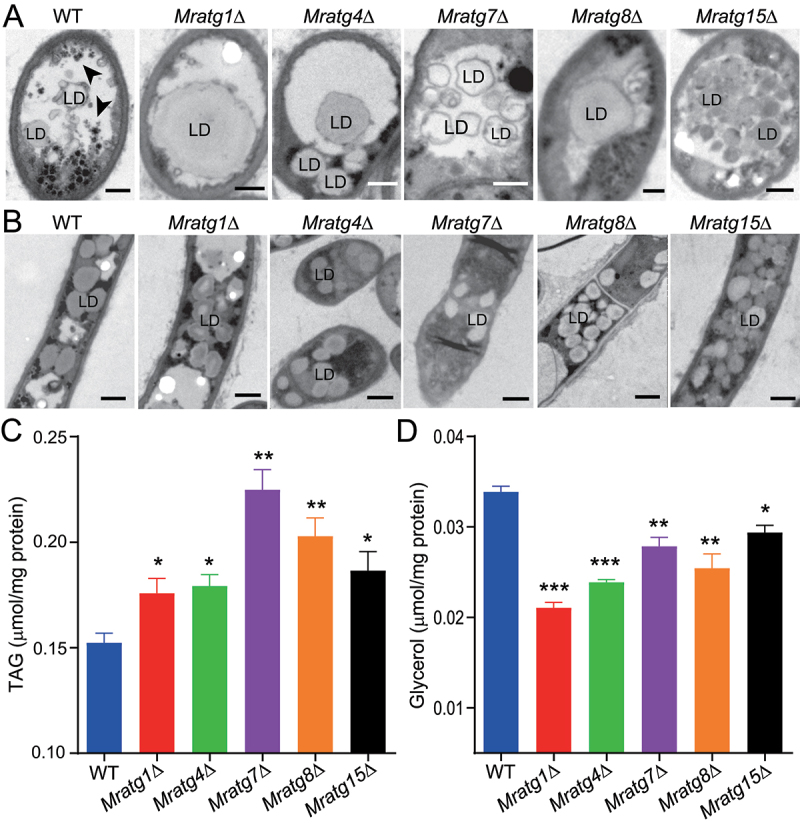
Variation in LD accumulation and degradation between strains. (A) TEM analysis of the vacuolar localization features of LDs in the WT and mutant mycelial cells after nitrogen starvation. The autophagic bodies are arrowed in the WT cell. Bar: 0.5 μm. (B) TEM featuring of the LDs outside the vacuoles of the WT and mutant mycelial cells after nitrogen starvation. Bar: 2 μm. (C) Quantification and comparison of the cellular TAG content between WT and mutants after nitrogen starvation. (D) Quantification and comparison of the cellular glycerol level between WT and mutants after nitrogen starvation. Fungal spores were inoculated in SDB for two days and transferred to the MM-N medium for 16 h. The significance of difference between WT and individual mutant is at: *, P < 0.05; **, P < 0.01; ***, P < 0.001.