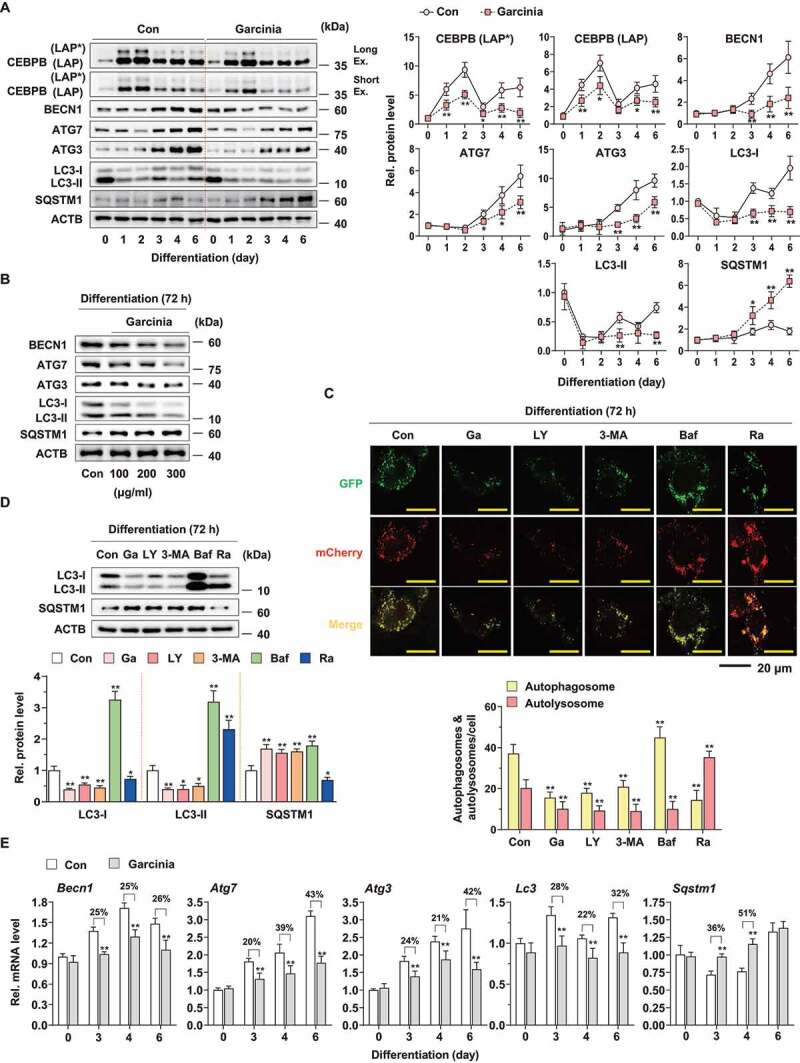
Figure 3.

Effect of G. cambogia extract on autophagic flux and autophagy-related gene expression in 3T3-L1 preadipocytes during differentiation. (A) Effect of G. cambogia extract (300 μg/ml) on CEBPB (LAP* and LAP), BECN1, ATG7, ATG3, LC3 and SQSTM1 expression in 3T3-L1 differentiated cells for the indicated times (n = 4 per group). *p < 0.05 and **p < 0.01 vs. each control. (B) Effect of G. cambogia extract (0–300 μg/ml) on BECN1, ATG7, ATG3, LC3 and SQSTM1 expression in 3T3-L1 differentiated cells for 72 h (n = 4 per group). (C) Fluorescence photographs and quantification data of mCherry-GFP-LC3 puncta in 3T3-L1 differentiated cells in response to G. cambogia extract (Ga, 300 μg/ml) for 72 h, LY294002 (LY, 10 μM), 3-methyladenine (3-MA, 0.5 mM), bafilomycin A1 (Baf, 100 μM) and rapamycin (Ra, 10 nM) for 24 h. The average number of autophagosomes (yellow) and autolysosomes (red) per cell was determined and analyzed (n = 9 per group). Scale bar: 20 μm. **p < 0.01 vs. each control. (D) Effect of G. cambogia extract (Ga, 300 μg/ml, 72 h), LY294002 (LY, 10 μM, 24 h), 3-methyladenine (3-MA, 0.5 mM, 24 h), bafilomycin A1 (Baf, 100 μM, 24 h) and rapamycin (Ra, 10 nM, 24 h) on LC3 and SQSTM1 expression in 3T3-L1 differentiated cells (n = 4 per group). *p < 0.05 and **p < 0.01 vs. each control. (E) Effect of G. cambogia extract (300 μg/ml) on the transcript levels of Becn1, Atg7, Atg3, Lc3 and Sqstm1 in 3T3-L1 differentiated cells for the indicated times (n = 9 per group). **p < 0.01 vs. each control. The data are the mean ± S.D.
