Figure 10.

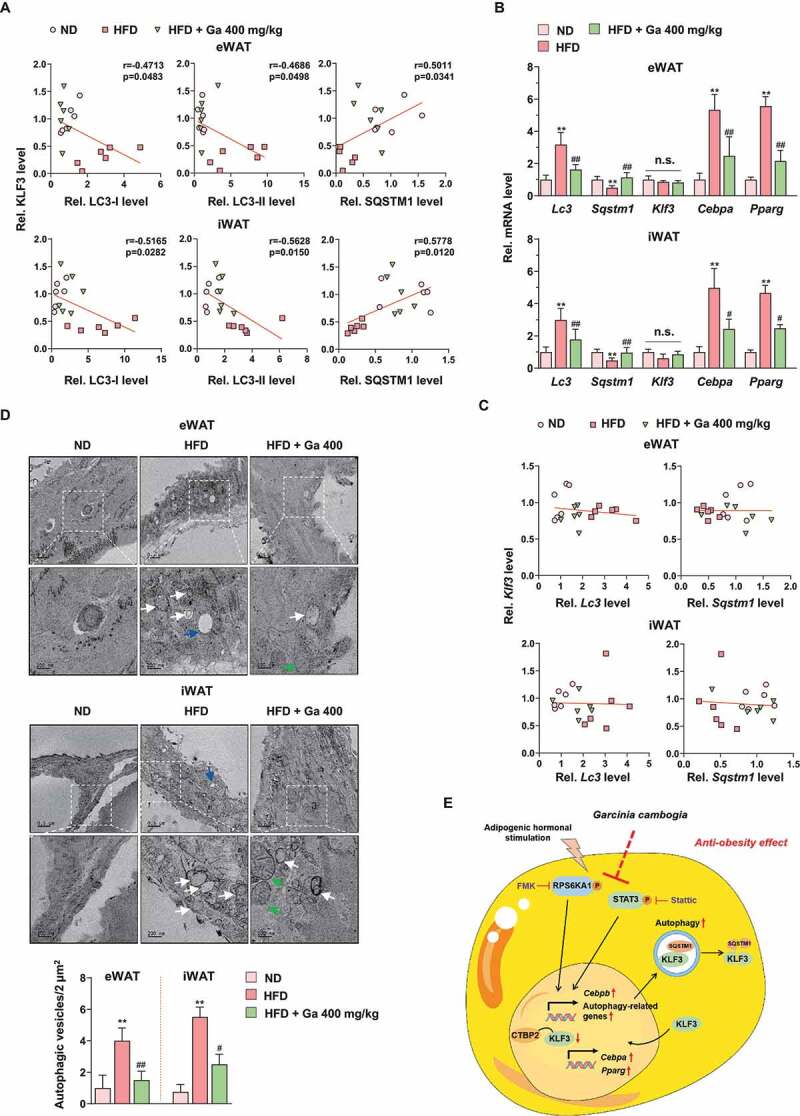
Analysis of the adipose tissues in the animal model. (A) Correlations between LC3-I, LC3-II, SQSTM1 and KLF3 protein expression in eWAT and iWAT (n = 6 per group). Each point represents one sample. (B) Lc3, Sqstm1, Klf3, Cebpa and Pparg transcript levels of eWAT and iWAT in ND-fed, HFD-fed and HFD-fed mice administered a high dose of G. cambogia extract (400 mg/kg) (n = 6 per group). (C) Correlations between Klf3, Lc3 and Sqstm1 transcript levels in eWAT and iWAT (n = 6 per group). Each point represents one sample. (D) Representative transmission electron micrographs of eWAT and iWAT in ND-fed, HFD-fed and HFD-fed mice administered a high dose of G. cambogia extract (400 mg/kg). The lower images are the enlarged representations of the boxed regions of the upper images. Scale bars: upper, 0.5 μm; lower, 200 nm. Autophagic vesicles are highlighted by white arrows and were quantified by counting the number of vesicles per 2 μm2 microscopic field in 4 randomly selected fields (n = 4 per group). Blue arrow: lipid droplet; green arrow: mitochondria. (E) Proposed mechanism for the antiobesity effect of G. cambogia extract in adipose tissue. **p < 0.01 vs. ND-fed mice, #p < 0.05 and ##p < 0.01 vs. HFD-fed mice. n.s.: not significant. The data are the mean ± S.D.
