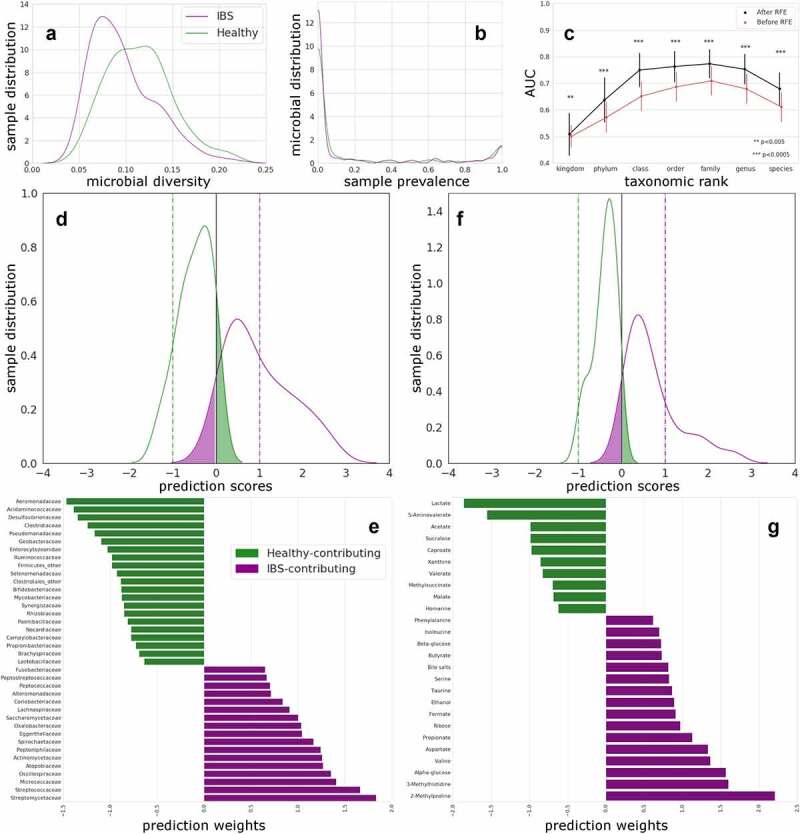
Figure 1.

Distinguishing HC and IBS using microbiome at different taxonomic ranks, and using fecal water metabolites.
(A) Diversity distribution, measured by the Simpson’s evenness metric, of the IBS (purple) and HC (green) cohorts is significantly (P = 1.01 × 10⁻⁶) different according to a Mann Whitney test. (B) Microbial prevalence distribution in HC and IBS; no significant difference is found. Graphs shows distribution of relative abundance of microbes (in %) across the HC and IBS samples. 0 indicates 0% and 1 indicates 100% of the individual microbes present. (C) AUC based on the different taxonomic ranks (indicated on the x-axis) for IBS versus HC, with standard deviation intervals, shown for the linear SVC models with (black) and without RFE (red). Significance is indicated for each paired (before vs after RFE) test. (D) Predicted scores as kernel density estimates from SVC models comparing IBS with HC (family-level data after RFE). Testing data separation from decision boundary. False positives are presented in the green shaded area of the curves and false negatives on the purple. Horizontal lines are drawn to indicate the optimal hyperplane (x = 0, black) and maximum margin (x = −1, HC; x = 1, IBS). (E) Bacterial relative abundance at family level presented as SVC weights for HCs and IBS patients. Twenty-one families, presented as SVC weights, were more abundant in HCs (in green) and 17 in IBS patients (in purple). (F) Predicted scores as kernel density estimates from SVC models comparing IBS with HCs for fecal metabolite data after RFE. Testing data separation from decision boundary. False positives are presented in the green shaded area of the curves and false negatives on the purple. Horizontal lines are drawn to indicate the optimal hyperplane (x = 0, black) and maximum margin (x = −1, HC (green); x = 1, IBS (purple)). (G) Fecal metabolites increased in HCs (green, negative weights) and in IBS patients (purple, positive weights) and contributing to the differentiation between the two groups in the SVC model.
