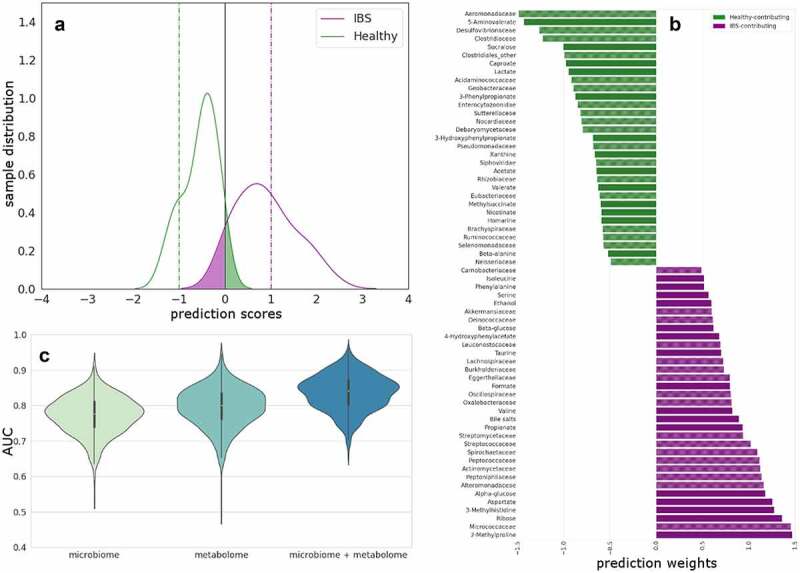
Figure 2.

Multi-omics integration to predict differences between HC and IBS.
(A) Combined linear RFE for IBS versus HC. Predicted scores shown as kernel density estimates from SVC models comparing IBS with HCs after RFE. Testing data separation from decision boundary. False positives are presented in the green shaded area of the curves and false negatives on the purple. Horizontal lines are drawn to indicate the optimal hyperplane (x = 0, black) and maximum margin (x = −1, HC (green); x = 1, IBS (purple)). (B) Combined fecal metabolites and microbiota families increased in HCs (green) and in IBS patients (purple) and contributing to the differentiation between the two groups in the SVC model. (C) Beanplots showing statistically significant differences in the AUC between models distinguishing IBS patients from HC based on microbiota-family, fecal metabolites and the combination of both. The corrected P-value for metabolome versus combined is 2.90 × 10−100 and microbiome versus combined is 2.77 × 10−56 (Wilcoxon test and FWER multiple correction).
