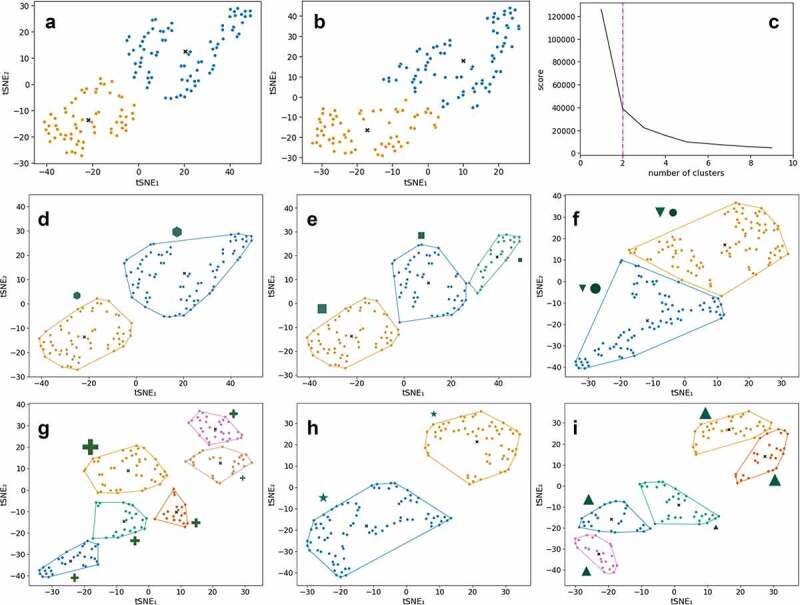
Figure 3a.

Unsupervised clustering using kernel t-SNE (kt-SNE)
(A-B) Two selected kt-SNE mappings from 1,000 individual t-SNE models with the optimal clusters indicated in colors (combined data of fecal metabolites and microbiota families). (C) Elbow plot of the average scores across the 1,000 individual kt-SNE models (combined data of fecal metabolites and microbiota families). (D-I) Subgroup analyses of clusters from kt-SNE analyses for which clinical/meta data variables were most significantly different between groups (see Figure S5 for results for all three datasets and all number of clusters, corrected for multiple testing). The relative size of the markers indicates the average value of the variable in the cluster. Each cluster is surrounded by the convex hull in the same color. (D) Duration of IBS symptoms (hexagon, Padj= 1.87 × 10⁻²) is significantly different between the two clusters in the combined data of fecal metabolites and microbiota families. (E) IBS symptoms triggered by stress (square, Padj= 3.67 × 10⁻³) is significantly different between the three clusters in the combined data of fecal metabolites and microbiota families. (F) Onset of IBS after stressful event (circle, Padj= 8.17 × 10⁻¹²) and serum 5-hydroxytryptamine (serotonin) (down-pointing triangle, Padj= 2.79 × 10⁻²) are significantly different between two clusters in the microbiome family-level data. (G) Sum of total dietary energy based on the food frequency questionnaire (cross, Padj= 4.15 × 10⁻²) is significantly different between six clusters in the microbiome family-level data. (H) 5-hydroxyindoleacetic acid in poor platelet plasma (star, Padj = 3.22 × 10⁻²) is significantly different between two clusters in the fecal metabolite data. (I) Medical history of abdominal surgery (upward-facing triangle, Padj= 3.86 × 10⁻²) is significantly different between five clusters in the fecal metabolite data.
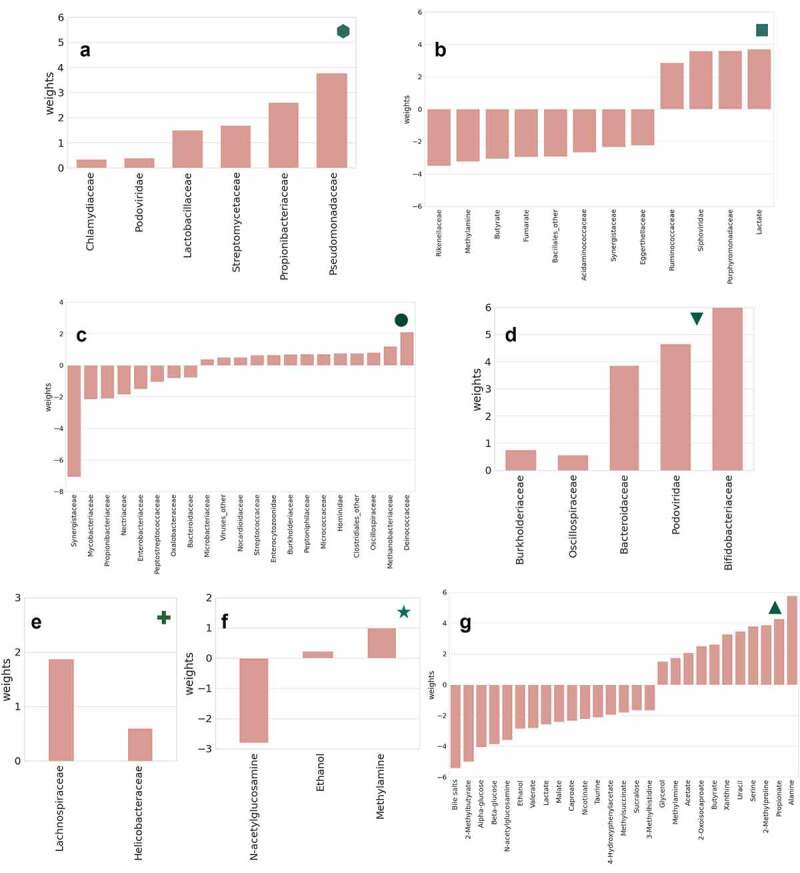
Figure 3b.

Important features for SVR/SVC models of clinical markers significantly different between clusters.
(A, hexagon) Microbiota families associated with the duration of IBS symptoms in this cohort (no metabolites are associated but were included in model). (B, square) Fecal metabolites and microbiota families associated with IBS symptoms triggered by stress. (C, circle) Microbiota families associated with onset of IBS after stressful event. (D, down-pointing triangle) Microbiota families associated with 5-hydroxytryptamine (serotonin) in poor platelet plasma. (E, cross) Microbiota families are associated with the sum of total dietary energy (from food frequency questionnaires). (F, star) Fecal metabolites associated with 5-hydroxyindoleacetate in poor platelet plasma (marker of serotonin metabolism). (G, upward-facing triangle) Fecal metabolites associated with medical history of abdominal surgery in this IBS patient cohort.
