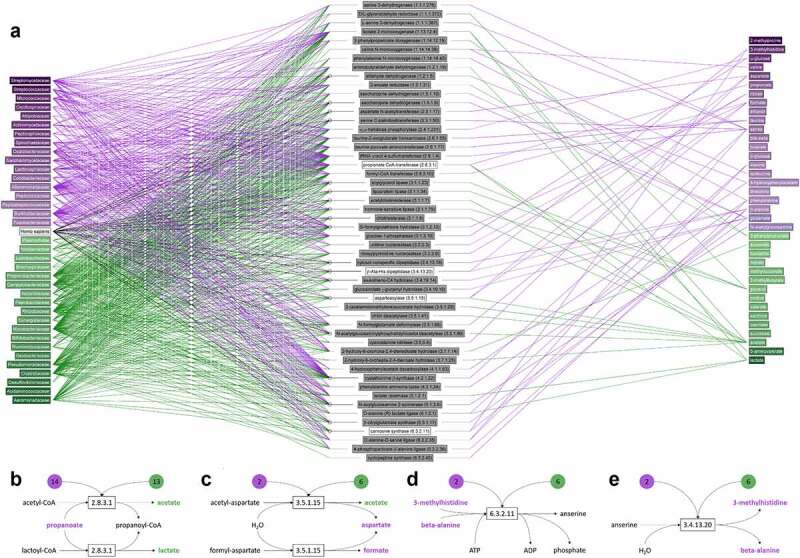
Figure 4.

Metabolites involved in reactions mediated by enzymes found in one or more of the microbial families. (a) Enzymatic reactions from all microbial species in the KEGG database that belong to the families that were identified in our microbiome analysis were included in this figure. Two metabolites were considered associated with each other if a biochemical reaction entry in KEGG indicates that they are a main reactant pair and the enzyme involved is linked to a human or microbial gene. Left column shows microbial families and Homo sapiens for reference, the right column the metabolites and the middle column the enzymes (enzyme code) that are encoded by genes from microbiota (and Homo sapiens) that mediate reactions involving one or more metabolites on the right. Microbial families and metabolites in green are increased in HCs and purple in IBS patients. This representation is based on the full metabolic reaction network in Figure S5. (b-e) Four reactions mediated by microbial enzymes that involve two or more metabolites associated with HC (green) or IBS (purple). The numbers in green and purple indicate the number of microbial families that have a gene encoding this enzyme. For web-based access of the Figure 4a, please check on the link https://imperialcollegelondon.box.com/s/ka1f3c3g64t0t1p0p6g4hgys0friaghm. In which you can point at any dot in the graph and all the lines attached to that dot are made visible. This provides perfect insight into our data and any connections that are present between different datasets.
