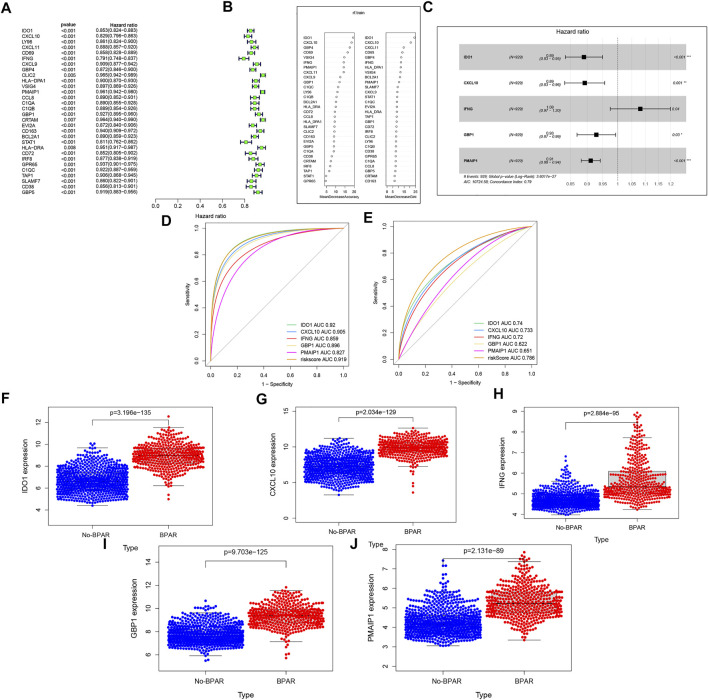
FIGURE 2.
(A): the single-factor prediction model of the training set. (B): According to the expression matrix of these 30 genes in the training set, the result of random forest dimensionality reduction. (C): the multi-factor prediction model of the expression matrix of these 10 genes in the training set. (D): ROC curve of the prediction result of the training set. (E): ROC curve of the prediction result of the validation set (F–J): the expression levels of these five target genes in the samples. Blue represents the expression in the No-BPAR group and orange represents the expression in the BPAR group with a p-value less than 0.05.

