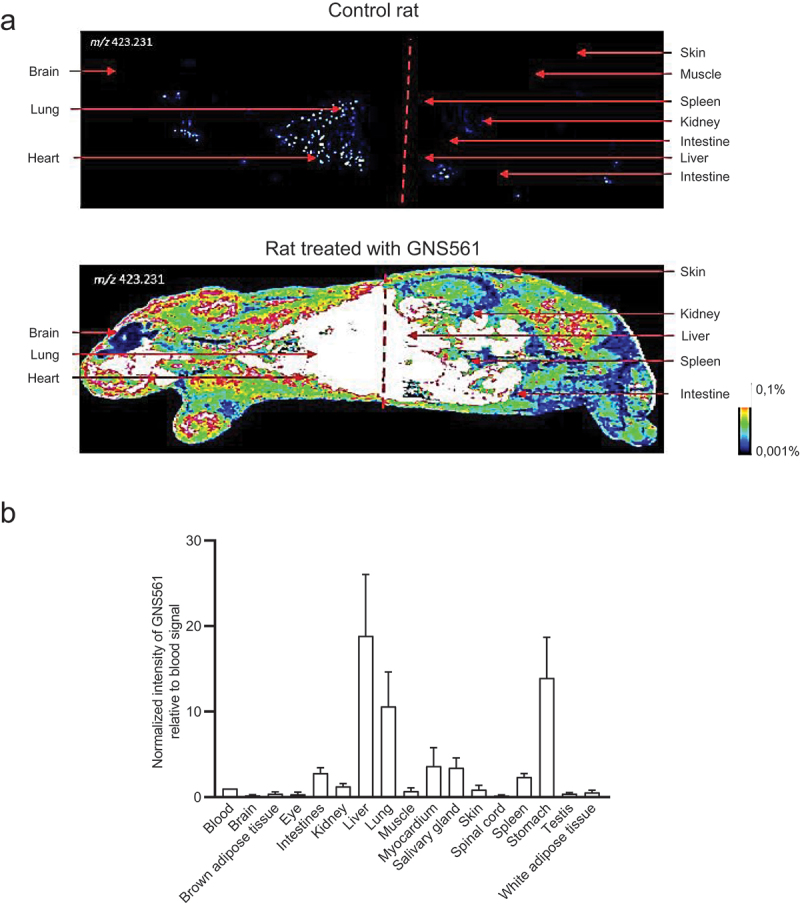
Figure 1.

Whole body tissue distribution of GNS561. (A) Mass spectrometry imaging of a control rat (top) and a rat treated with GNS561 at a dose of 40 mg/kg/day for 28 days (bottom). (B) Normalized intensity of GNS561 relative to blood signal in several organs of GNS561-treated rats (Mean + SEM, n = 2 except for eye, n = 1). Of note, the GNS561 liver-to-blood ratio is underestimated due to liver signal saturation.
