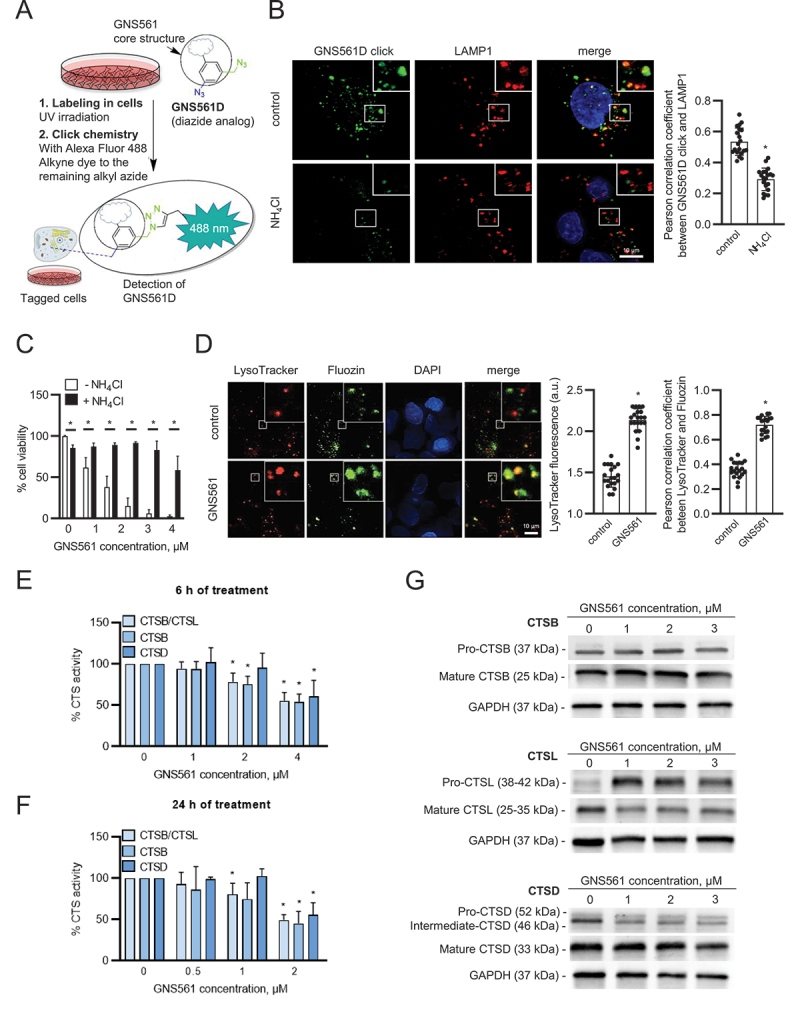
Figure 4.

The lysosomotropic agent GNS561 modulates lysosomal functions in the HepG2 cell line. (A) Chemical labeling of GNS561D in cells. The UV-irradiation activates the aryl azide, and then the click chemistry activates the alkyl azide to create the fluorescent moiety with the dye. (B) Lysosomal localization of GNS561D after NH4Cl pre-treatment (20 mM) for 30 min and then treatment with GNS561D (10 µM) and NH4Cl (20 mM) for 90 min. (C) Cell viability after 24 h of GNS561 exposure in the presence or absence of NH4Cl (20 mM). (D) Staining of lysosomes (LysoTracker) and unbound Zn2+ (Fluozin) after GNS561 treatment (1 h, 10 µM). Quantification of LysoTracker fluorescence in arbitrary units (a.u.) (middle panel) and lysosomal unbound Zn2+ accumulation by Pearson correlation coefficient between LysoTracker and Fluozin (right panel). Fold change of peptidase activity of cysteine cathepsins (including both CTSB-CTSL), CTSB and CTSD after (E) 6 h and (F) 24 h of treatment with GNS561 calculated in comparison with the control condition. (G) Representative immunoblotting of pro-CTSB (precursor form) and mature CTSB (top), pro-CTSL (precursor form) and mature CTSL (middle) and pro-CTSD, intermediate and mature CTSD (bottom) after GNS561 treatment for 16 h. For all blots, GAPDH was used as a loading control. For all studies, n ≥ 3 biological replicates. Data represent the mean + SEM. For comparison, Student t-test was used for (B), (C) and (D), and one-way ANOVA with Dunnett’s post hoc analysis was performed for (E) and (F). *represents significant difference, at least p < 0.05.
