
Figure 1. Pancreatic islet cell type accessible chromatin defined using snATAC-seq.
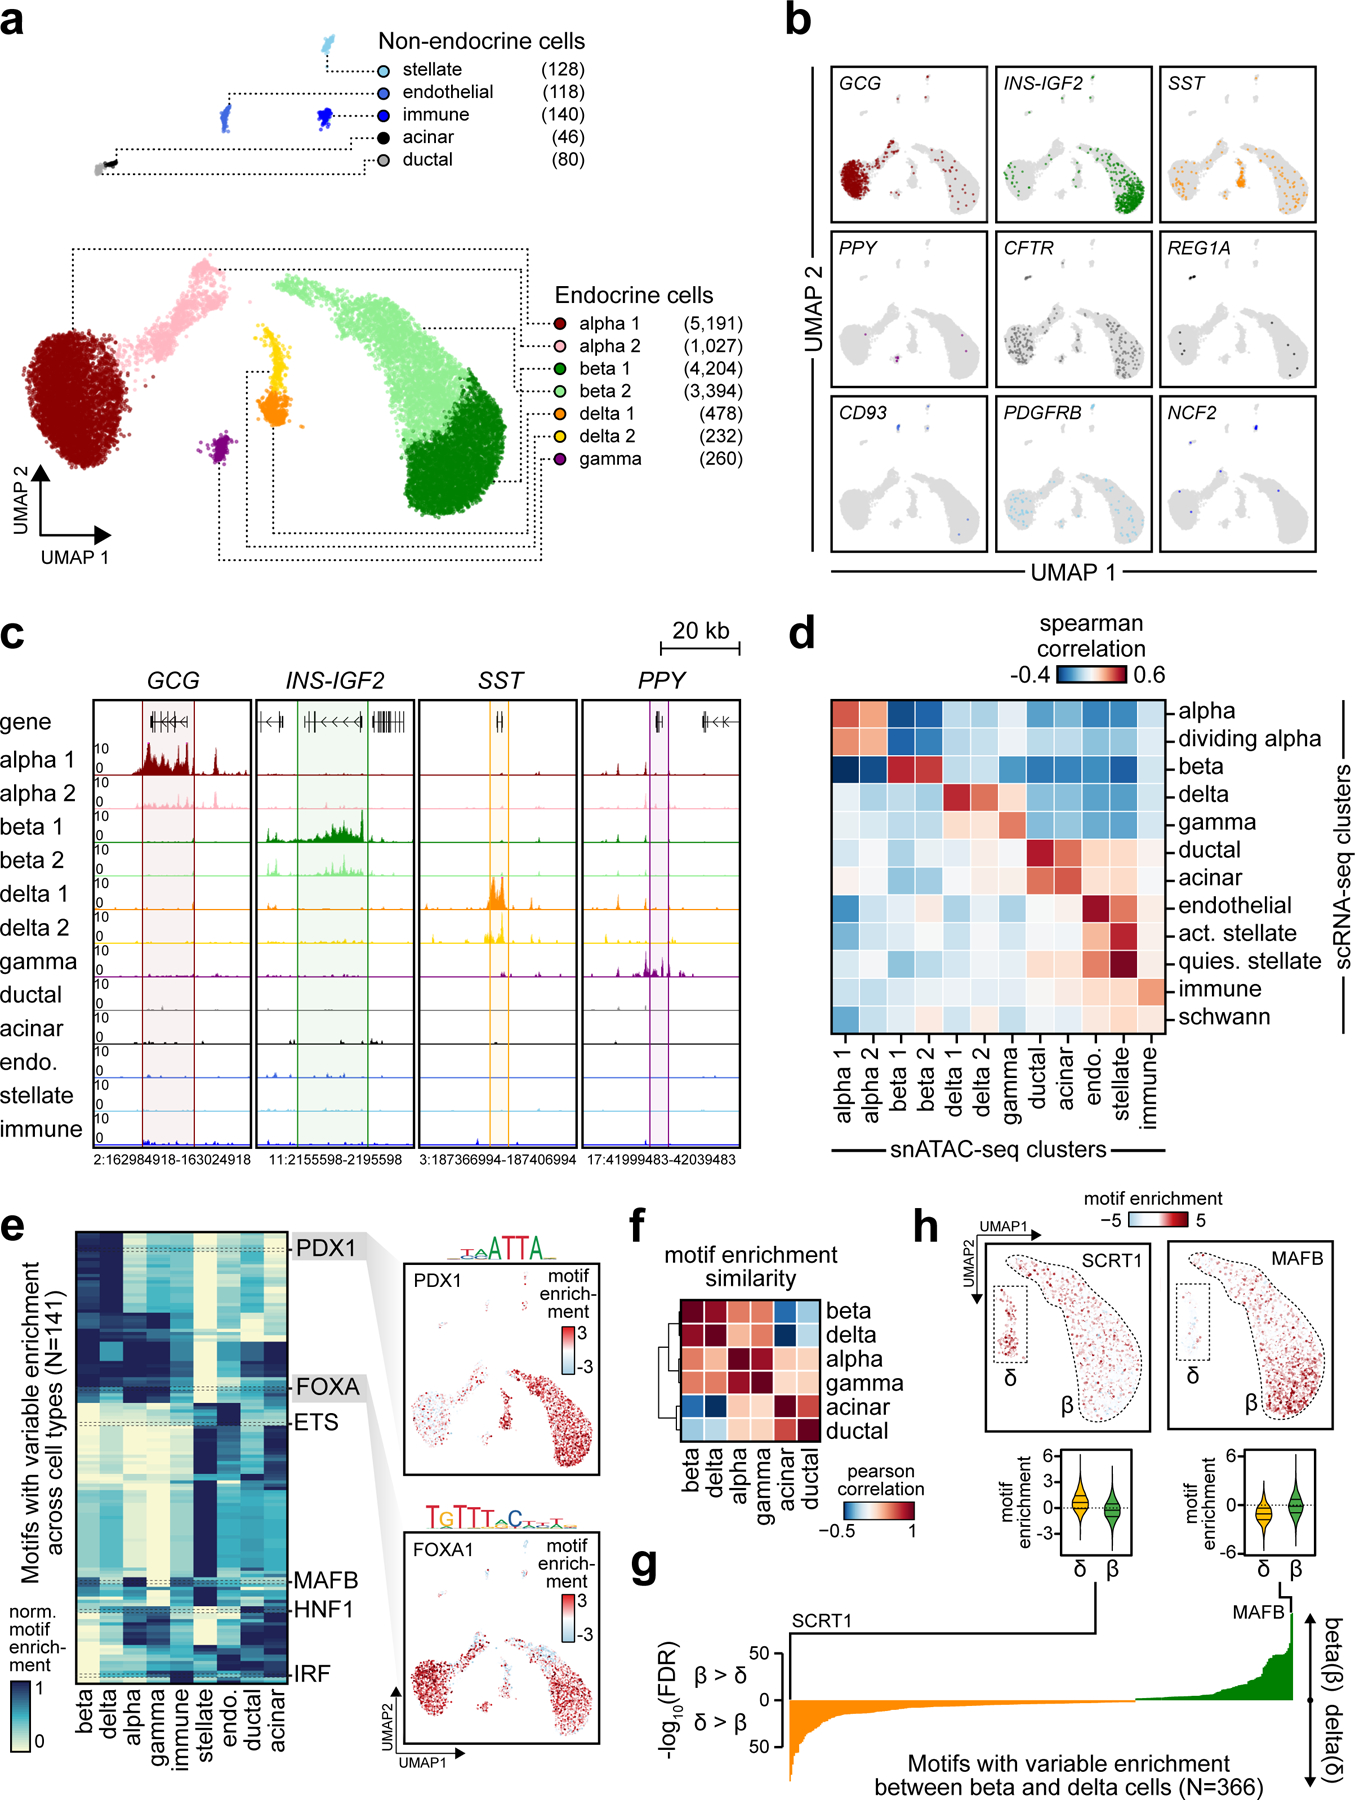
(a) Clustering of accessible chromatin profiles from 15,298 pancreatic islet cells identifies 12 distinct clusters plotted on UMAP coordinates. The number of cells for each cluster is listed in parenthesis next to the cluster label. (b) Promoter accessibility in a 1 kb window around the TSS for selected marker genes. (c) Aggregate read density (counts per 1×10⁵) at hormone marker genes: GCG (alpha), INS-IGF2 (beta), SST (delta), and PPY (gamma). (d) Spearman correlation between t-statistics of cluster-specific genes based on promoter accessibility (snATAC-seq) and gene expression (scRNA-seq). (e) Row-normalized chromVAR motif enrichment z-scores for 141 TF sequence motifs with variable enrichment across clusters (left). Cell types with multiple clusters are collapsed into a single cluster (e.g. beta 1 + beta 2 into beta). Enrichment z-scores for FOXA1 and PDX1 motifs for each cell projected onto UMAP coordinates (right). (f) Pearson correlation of TF motif enrichment z-scores between endocrine and exocrine cell types (g) FDR-corrected p-values from two-sided two sample T-tests of differential chromVAR motif enrichment comparison between delta and beta cells for 366 TF motifs. (h) Enrichment z-scores for SCRT1 and MAFB motifs in 7,598 beta and 710 delta cells projected onto UMAP coordinates (top) and shown as violin distributions (bottom; lines represent median and quartiles).