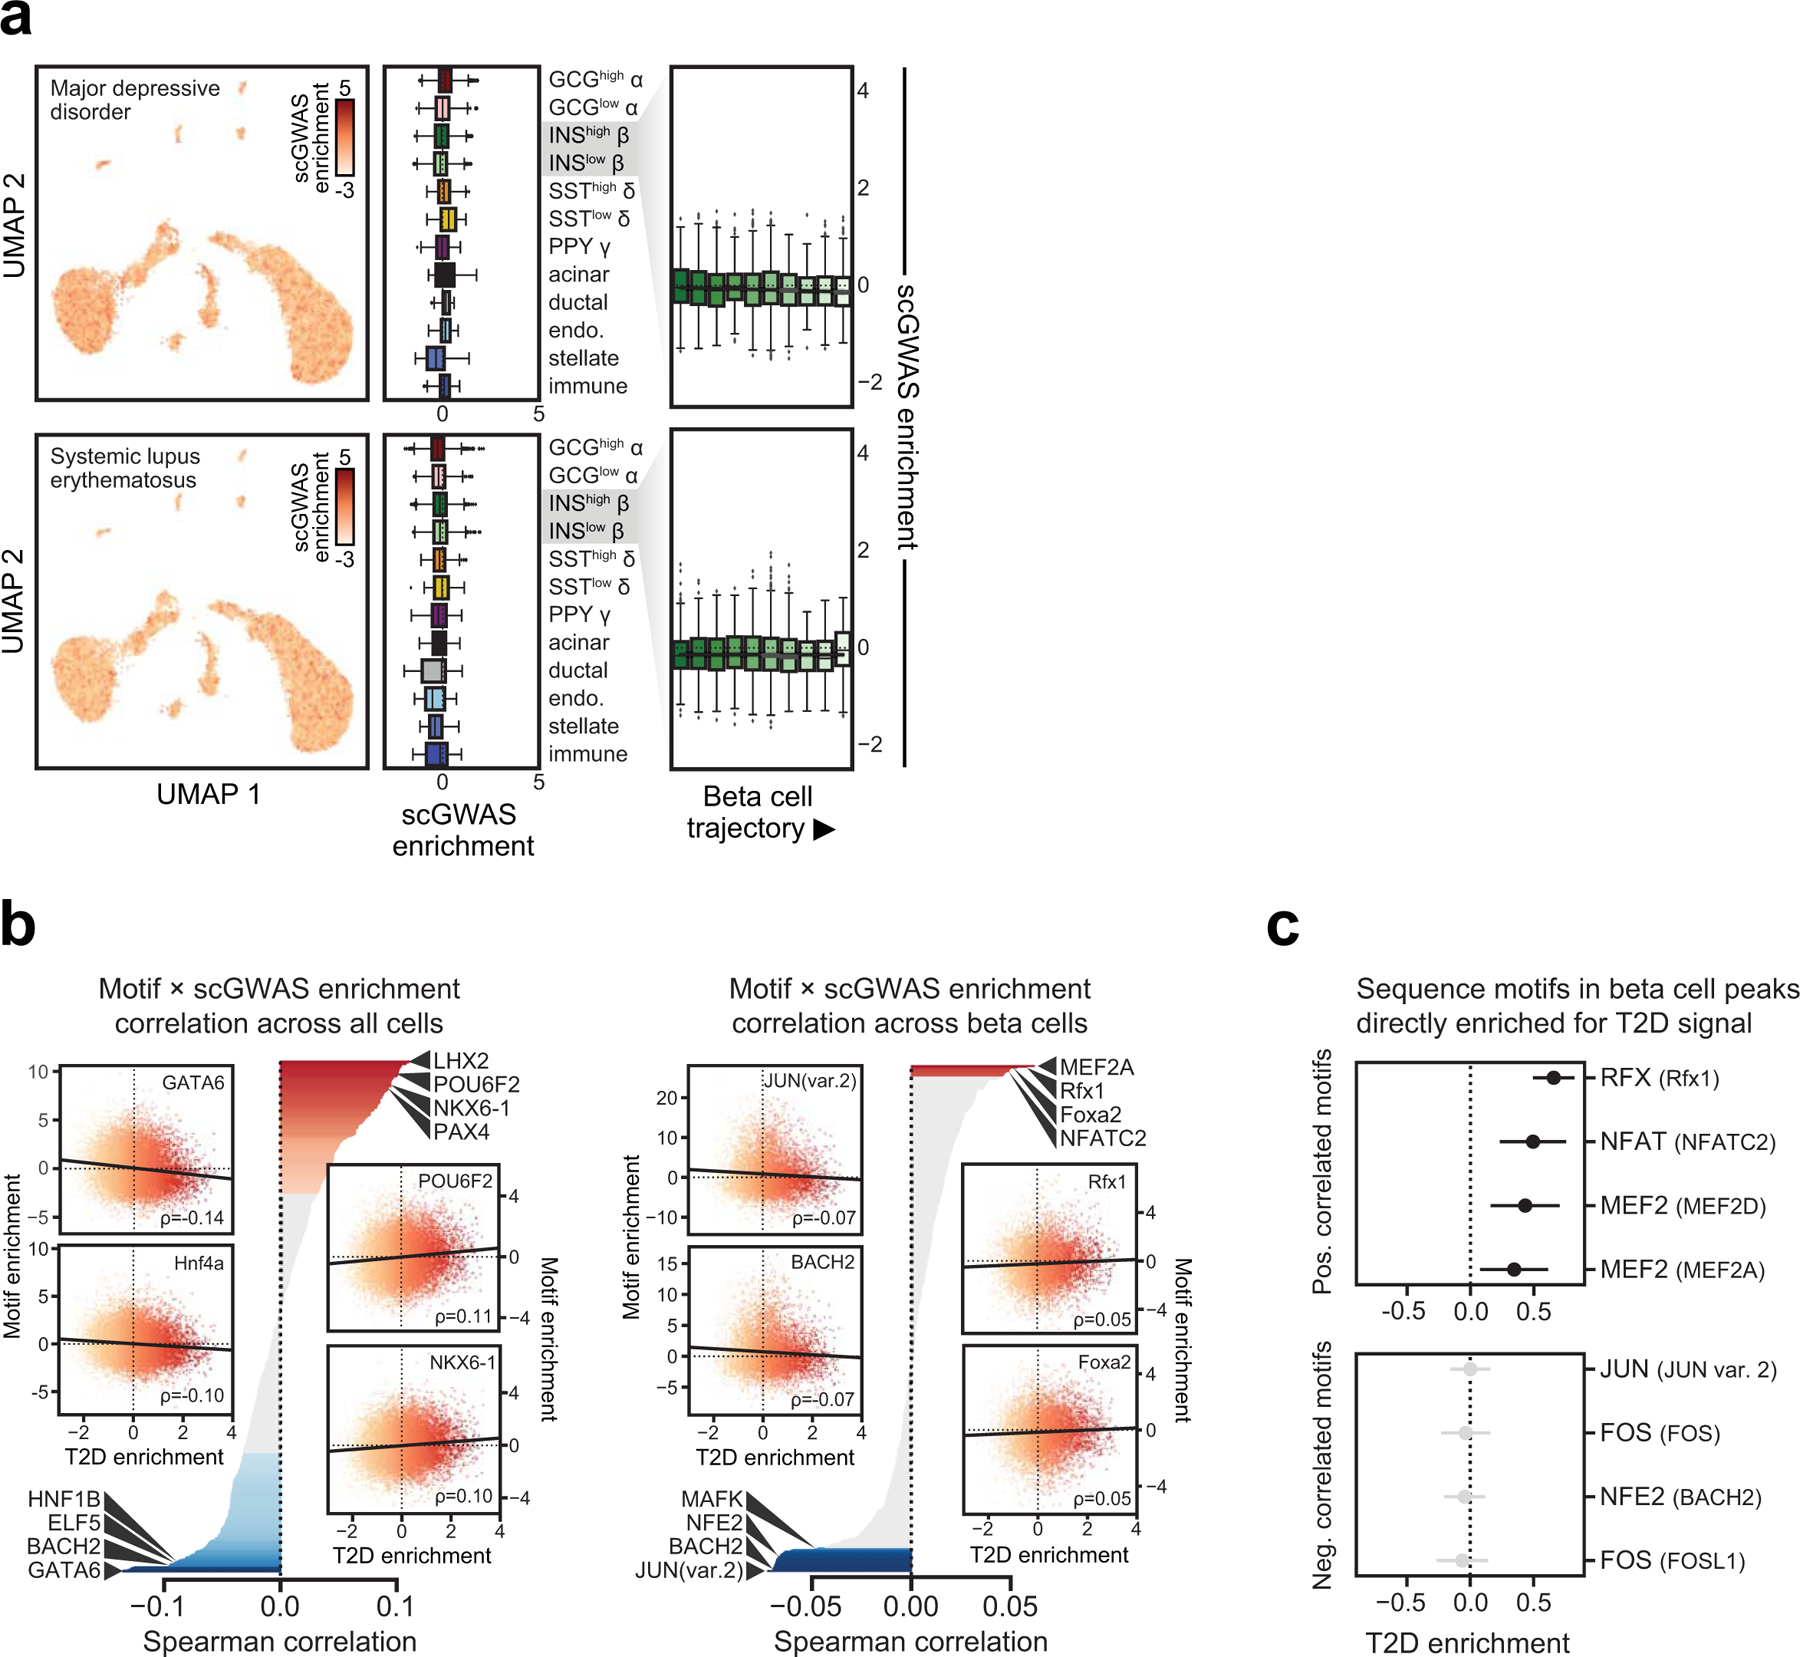
Extended Data Fig. 6. Single cell GWAS enrichment and correlation with TF motifs.

(a) Single cell GWAS enrichment z-scores for Major depressive disorder and Systemic lupus erythematosus projected onto UMAP coordinates (left panels), z-score enrichment distribution per cell type and state (middle panels) and z-score enrichment distribution split into 10 bins based on beta cell trajectory values (right panels). Boxplot center lines, limits, and whiskers represent median, quartiles, and 1.5 IQR respectively. (b) Correlation between single cell GWAS enrichment z-scores for Type 2 Diabetes and chromVAR TF motif enrichment z-scores across either all cells (left) or beta cells (right). Inset scatterplots highlight the top correlated motifs in either direction. (c) Variants mapping directly in sequence motifs positively correlated with T2D risk in beta cells are enriched for T2D association, whereas variants mapping in motifs negatively correlated with T2D risk in beta cells show no such enrichment. Values represent effect size and SE.
