
Extended Data Fig. 10. Genome editing of the KCNQ1 locus in hESCs.
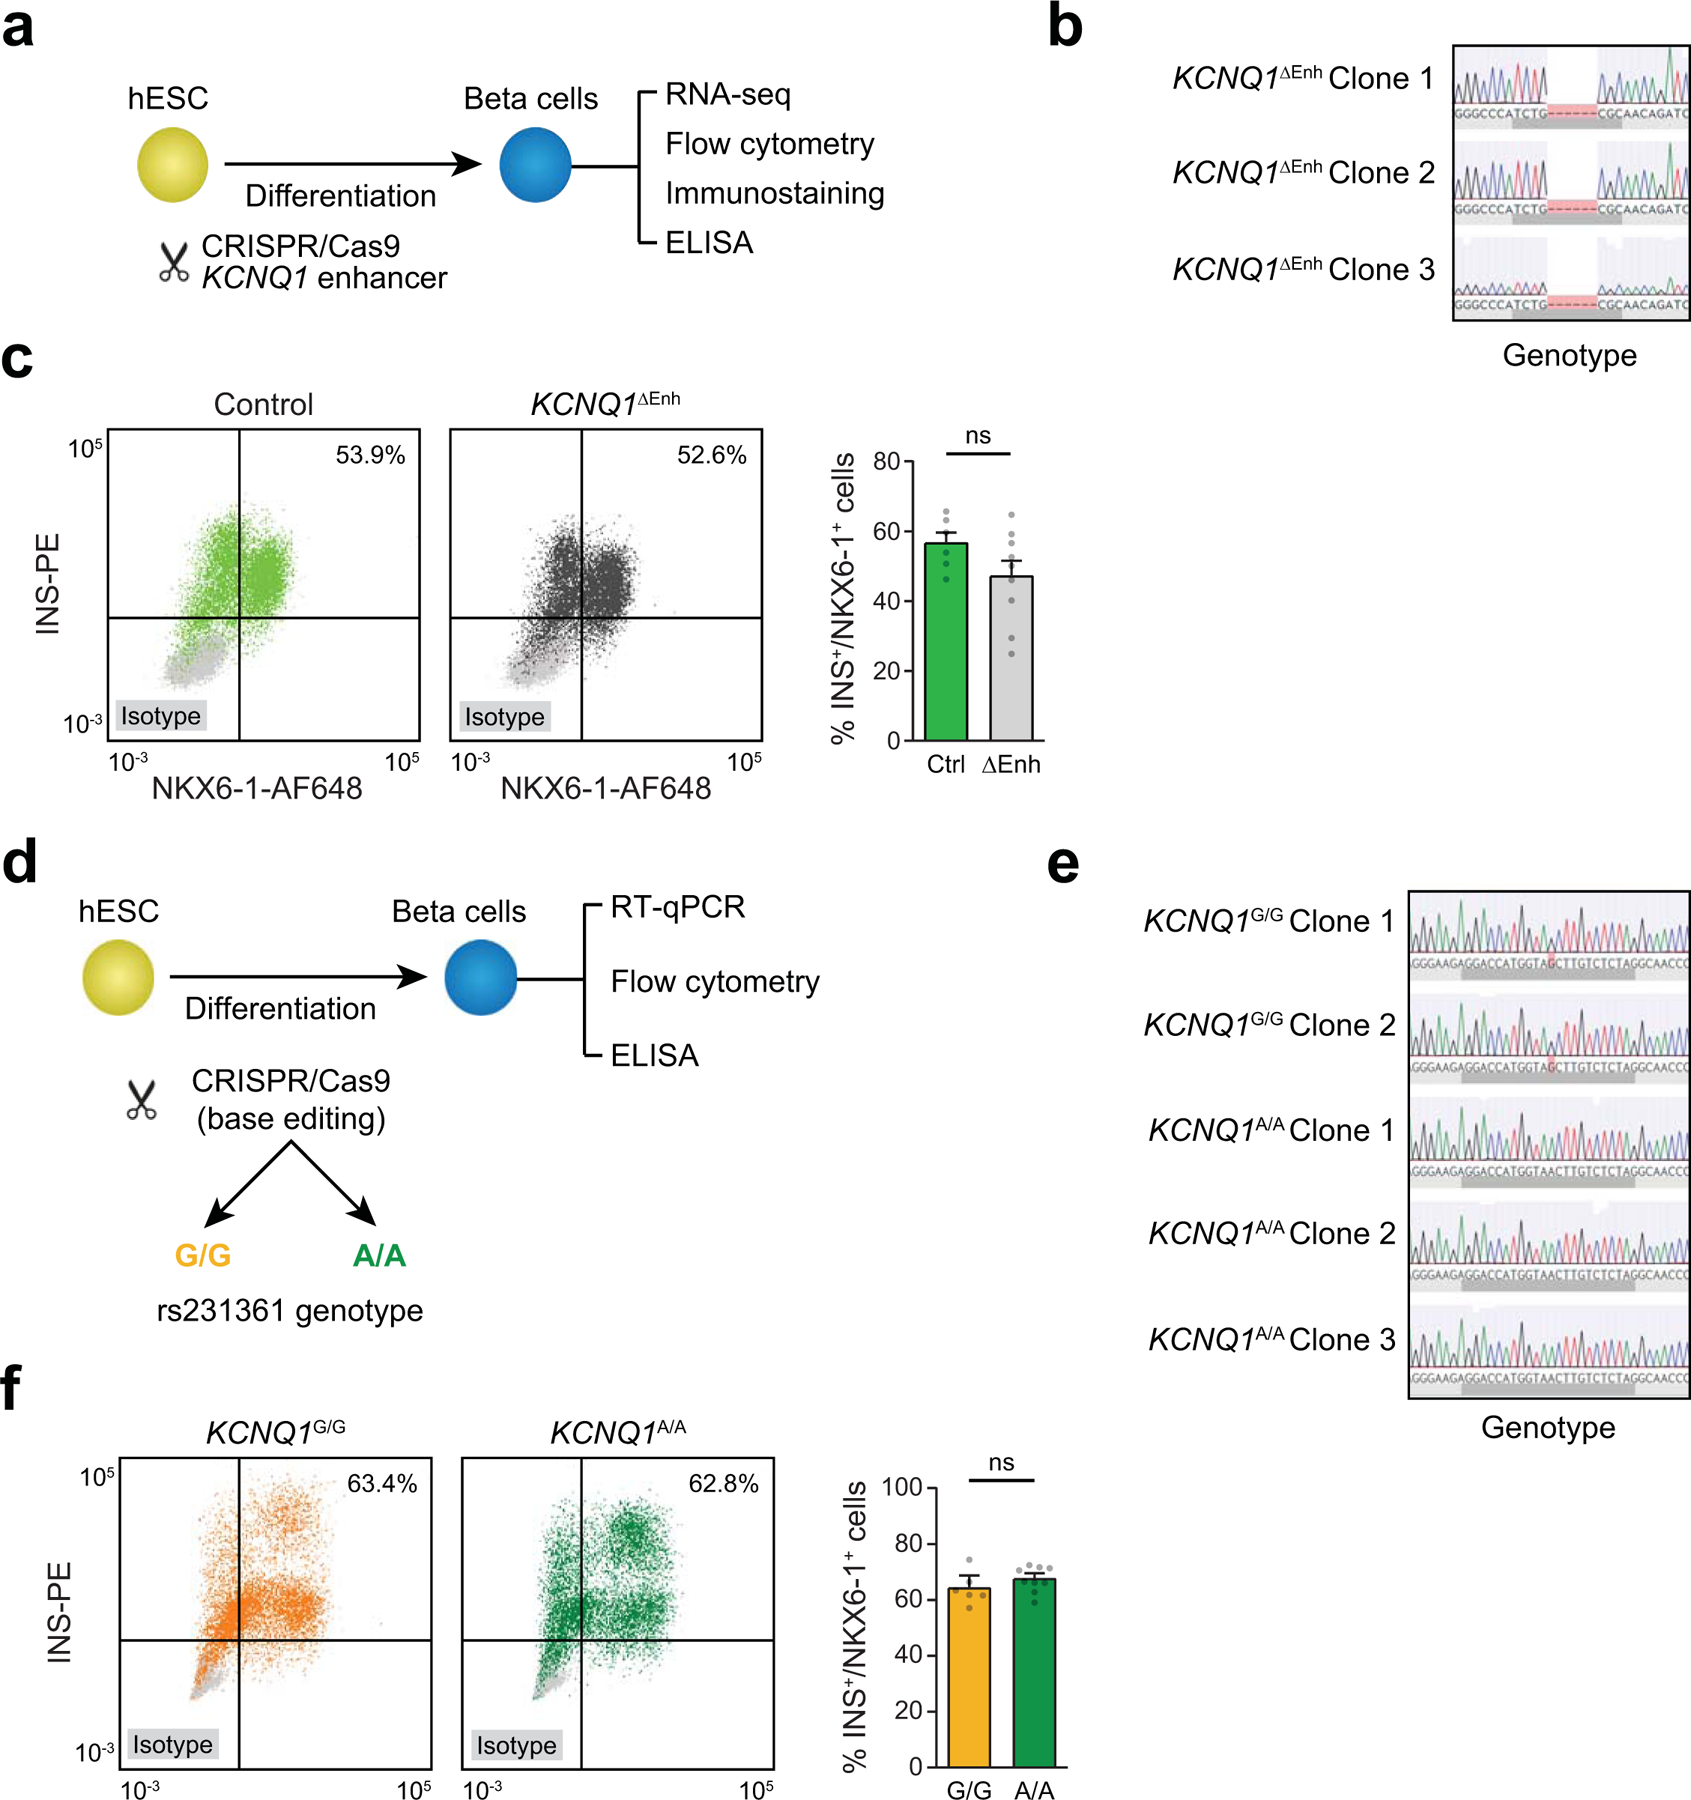
(a) Schematic of the workflow and (b) Sanger sequencing for KCNQ1 enhancer deletion in three independent hESC clones. (c) Representative figures of flow cytometry analysis for NKX6–1 and INS comparing control and KCNQ1ΔEnh cells (left). Quantification of the percentage of NKX6–1+/INS+ cells in beta cell stage cultures from control (n=6; 2 clones × 3 differentiations) and KCNQ1∆Enh (n=9; 3 clones × 3 differentiations) cells (right). Values represent mean and SEM. ns, not significant by two-sided Student’s T-test without adjustment for multiple comparisons. (d) Schematic of the workflow and (e) Sanger sequencing for two independent KCNQ1G/G clones and three KCNQ1A/A clones. (f) Representative figures of flow cytometry analysis for NKX6–1 and INS comparing KCNQ1G/G and KCNQ1A/A clones (left). of the percentage of NKX6–1+/INS+ cells in beta cell stage cultures from KCNQ1G/G (n=6; 2 clones × 3 differentiations) and KCNQ1A/A (n=9; 3 clones × 3 differentiations) cells (right). ns, not significant by two-sided Student’s T-test without adjustment for multiple comparisons. Values represent mean and SEM.