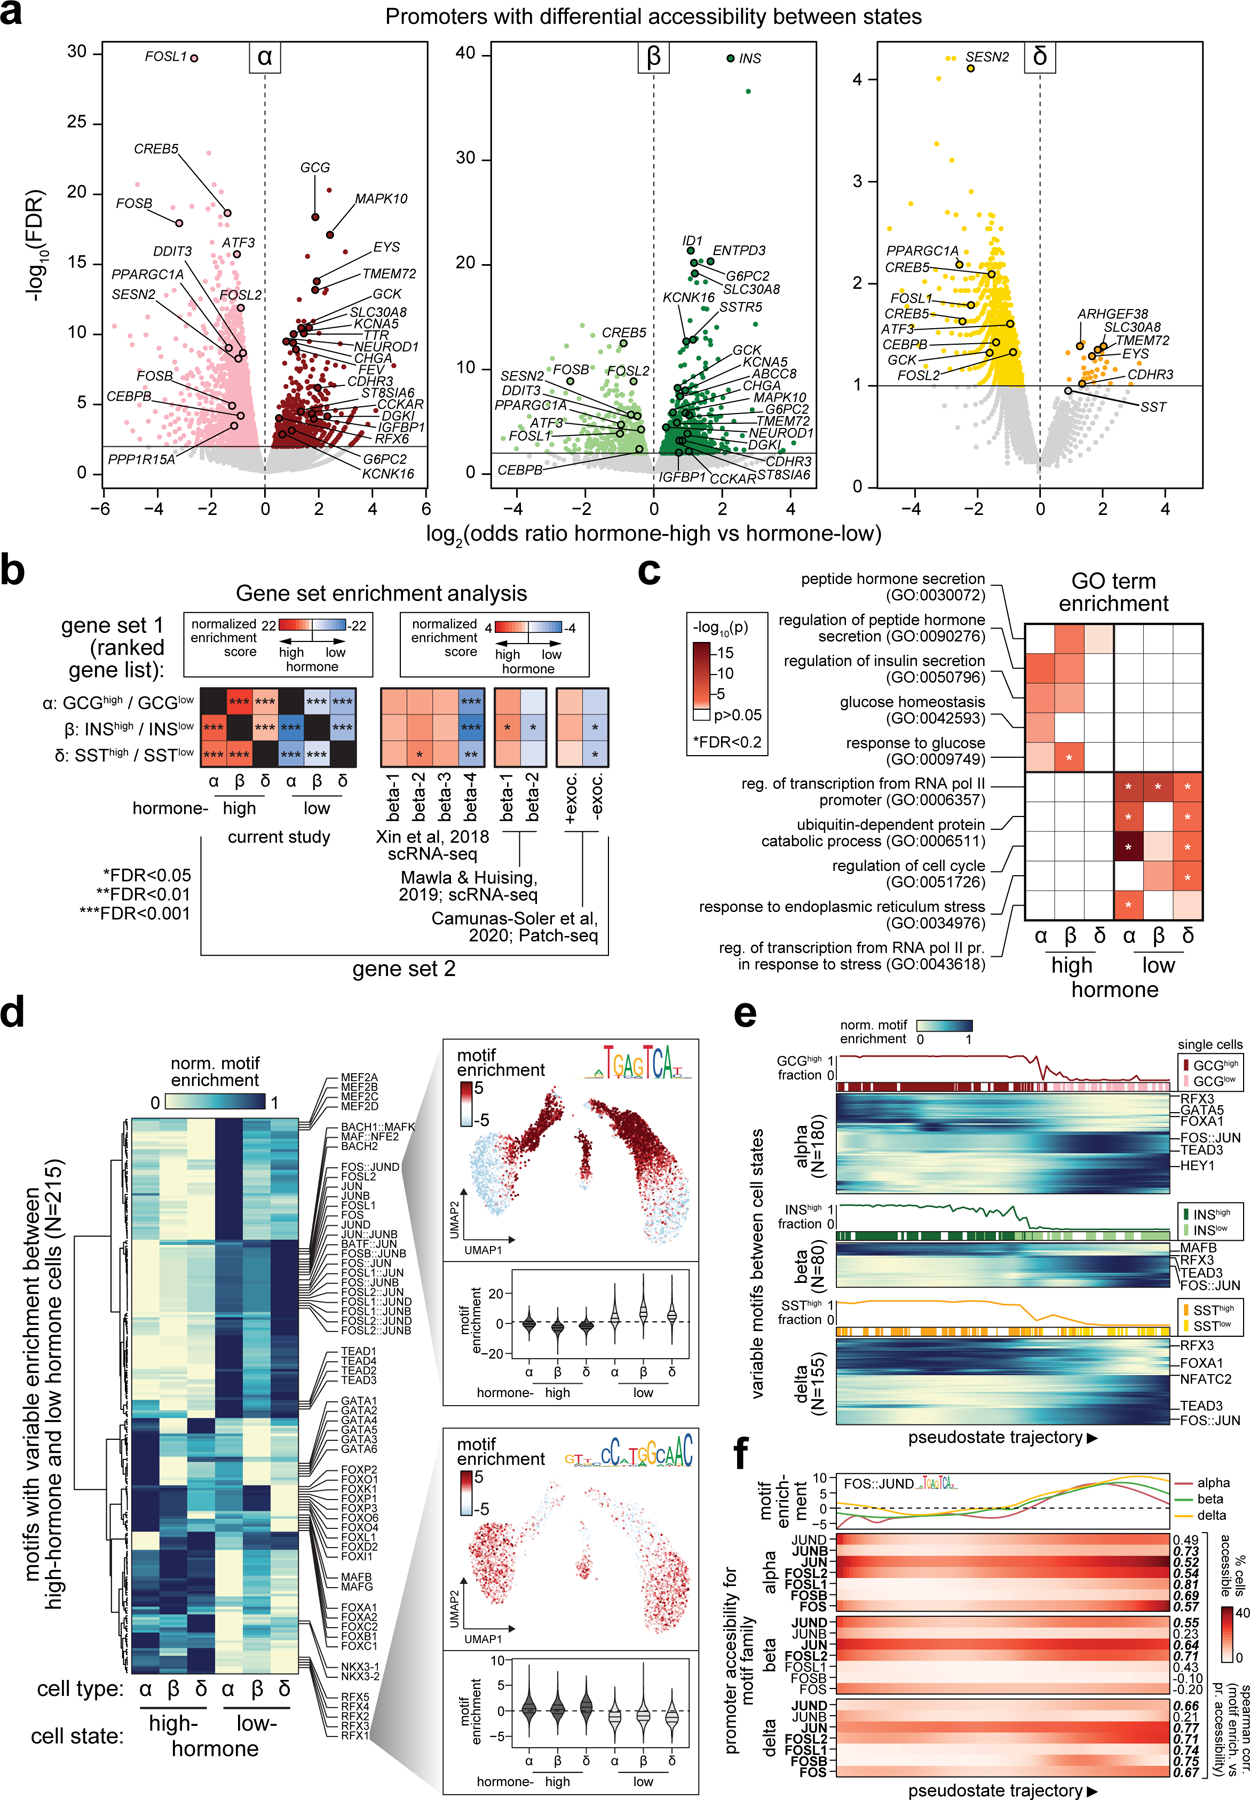
Figure 2. Heterogeneity in endocrine cell accessible chromatin and regulatory programs.

(a) Gene promoters with significantly differential chromatin accessibility between sub-clusters of alpha cells (left), beta cells (middle), and delta cells (right). (b) Enrichment of gene sets using ranked gene lists from the differential promoter analyses. Panels include genes with differential promoter accessibility between hormone-high or hormone-low states (first subpanel from left); genes expressed in beta cell sub-clusters from islet scRNA-seq (second and third subpanels); genes positively and negatively correlated with exocytosis from islet Patch-seq (fourth subpanel). (c) Enrichment of gene ontology terms related to glucose response, hormone secretion, stress response, and cell cycle among genes with differential promoter accessibility between endocrine cell states. (d) Row-normalized motif enrichments for 215 TF motifs with variable enrichment across endocrine cell states. Single cell motif enrichment z-scores for a representative RFX (RFX3) and FOS/JUN (FOS::JUN) motif are projected onto UMAP coordinates (right), and violin plots below show motif enrichment distribution within endocrine cell states (lines represent median and quartiles). (e) Ordering of alpha, beta and delta cells across pseudostate trajectories using high GCG/INS-IGF2/SST promoter accessibility as the reference point. Across each trajectory, the percentage of cells in the hormone-high state and the binary cluster call of individual cells are shown above the heatmaps, which show row-normalized motif enrichment for variable motifs between cell states. (f) Promoter accessibility for genes in the FOS/JUN motif family across pseudostate trajectories. Genes with matching promoter accessibility and motif enrichment patterns (ρ>0.5) are bolded.
