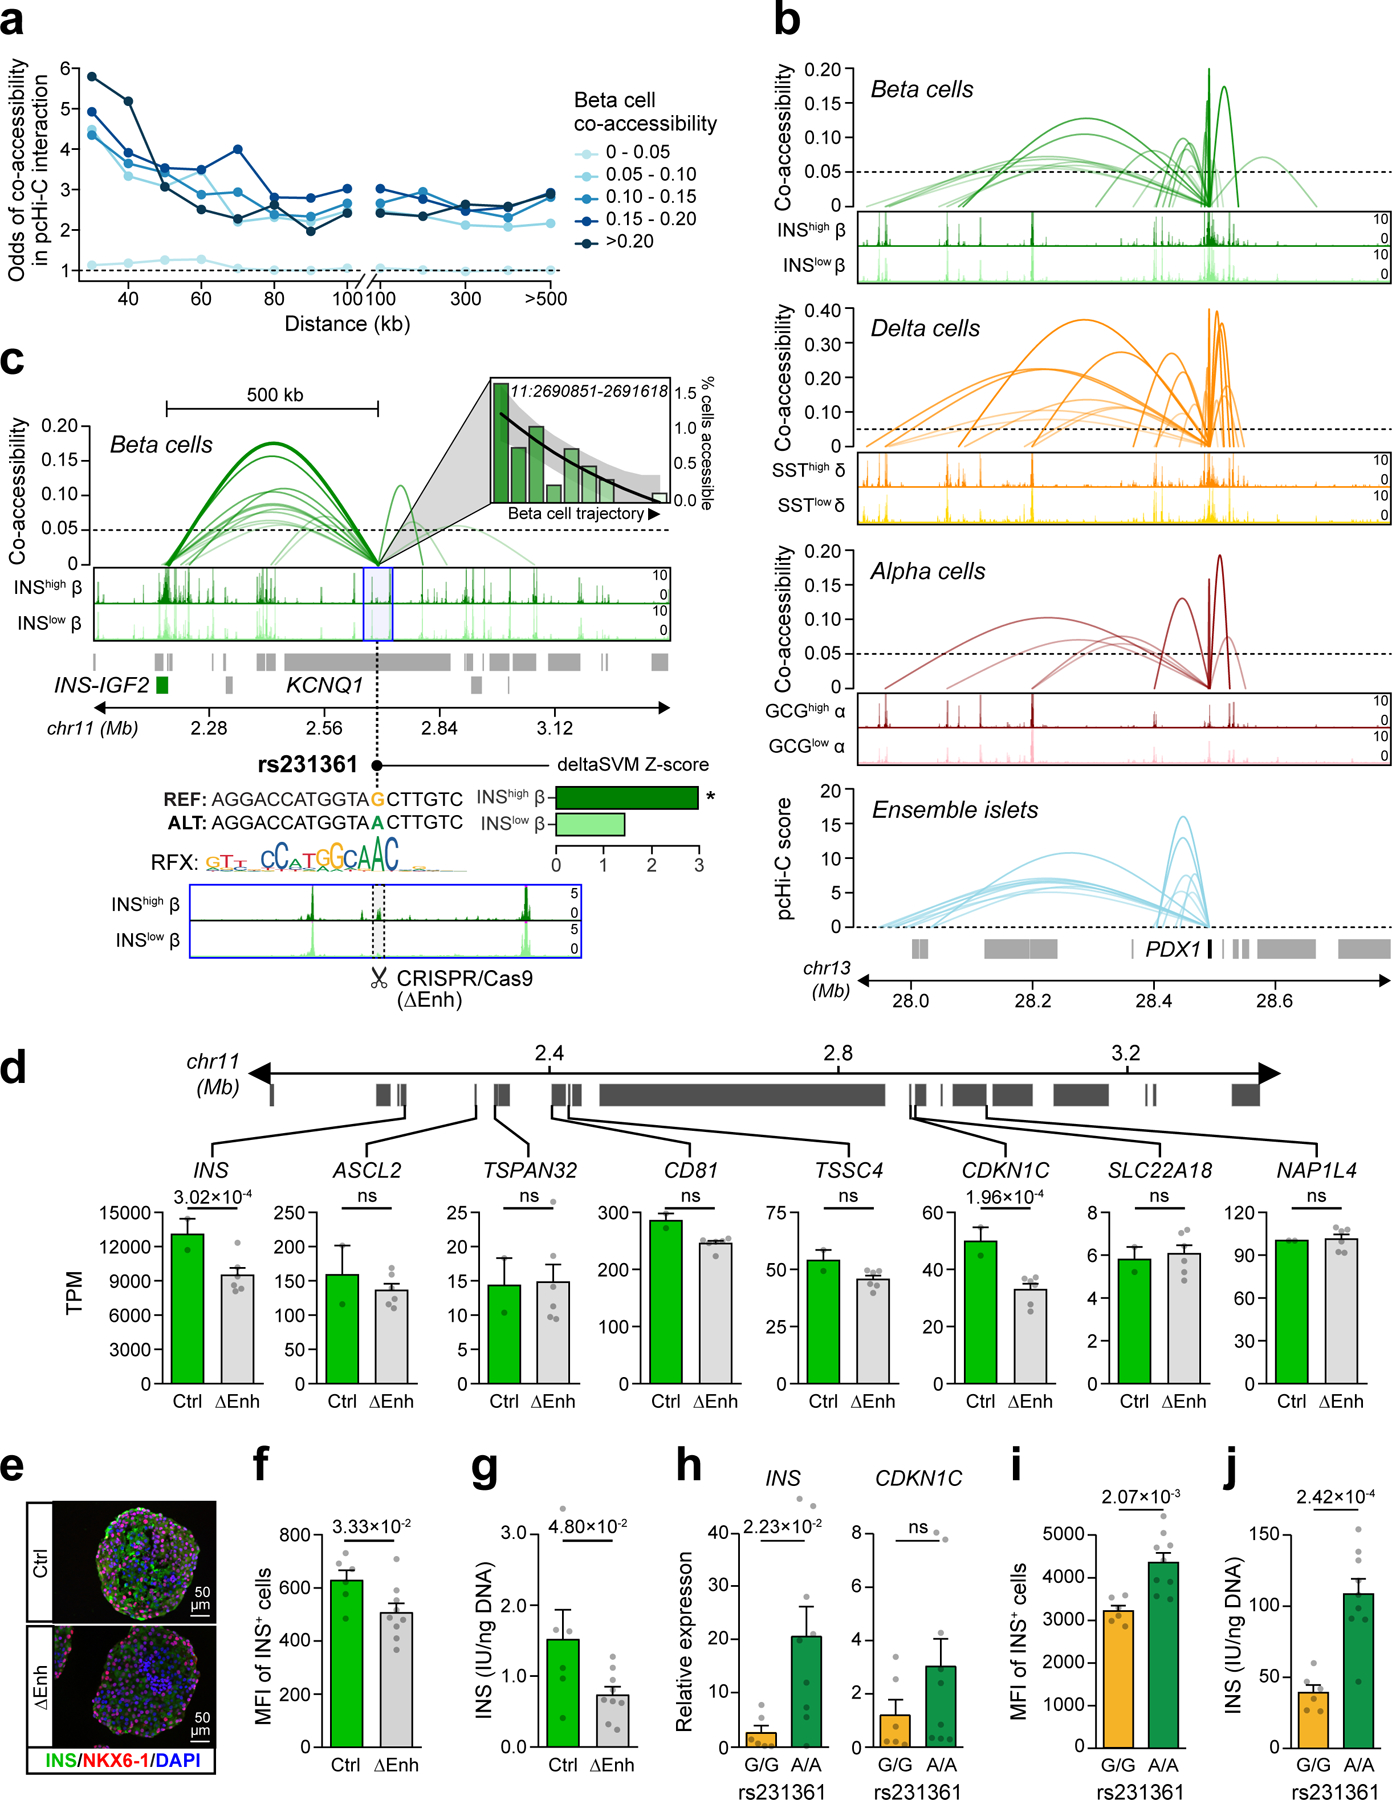
Figure 5. Chromatin co-accessibility links diabetes risk variants to target genes.

(a) Distance-matched odds that co-accessible sites in beta cells overlap islet pcHi-C interactions at different threshold bins. (b) Single cell co-accessibility and islet pcHi-C interactions at the PDX1 promoter. (c) Enhancer harboring T2D variant rs231361 shows distal beta cell co-accessibility to the INS promoter and other non-promoter sites. The enhancer is accessible in INShigh but not INSlow beta and has decreasing accessibility across the beta cell trajectory. rs231361 disrupts an RFX motif and has predicted effects in INShigh beta. *FDR<0.1. CRISPR/Cas9 deletion of a 2.6 kb region (highlighted, ∆Enh) around the enhancer. (d) Expression (transcripts per million, TPM±SEM) of genes within 2 Mb of the enhancer in beta cell stage cultures for ∆Enh (n=6; 3 clones × 2 differentiations) and control (n=2; 1 clone × 2 differentiations), p-values from DESeq2, ns not significant. (e) Representative immunofluorescence staining for INS (green), NKX6–1 (red), and DAPI (blue) in beta cell stage cultures for ∆Enh (n=3 independent experiments) and control (n=3 experiments) (f) Quantification of INS median fluorescence intensity (MFI) and (g) INS content in beta cell stage cultures for ∆Enh (n=9; 3 clones × 3 differentiations) and control (n=6; 2 clones × 3 differentiations). (h) Relative expression of INS and CDKN1C, (i) Quantification of INS MFI, and (j) INS content in beta cell stage cultures for KCNQ1A/A (n=9; 3 clones × 3 differentiations) and KCNQ1G/G (n=6; 2 clones × 3 differentiations). Data shown are mean±SEM, p-values by two-sided Student’s T-test, ns, not significant.
