
Extended Data Fig. 2. Flowchart of the snATAC-seq data processing pipeline.
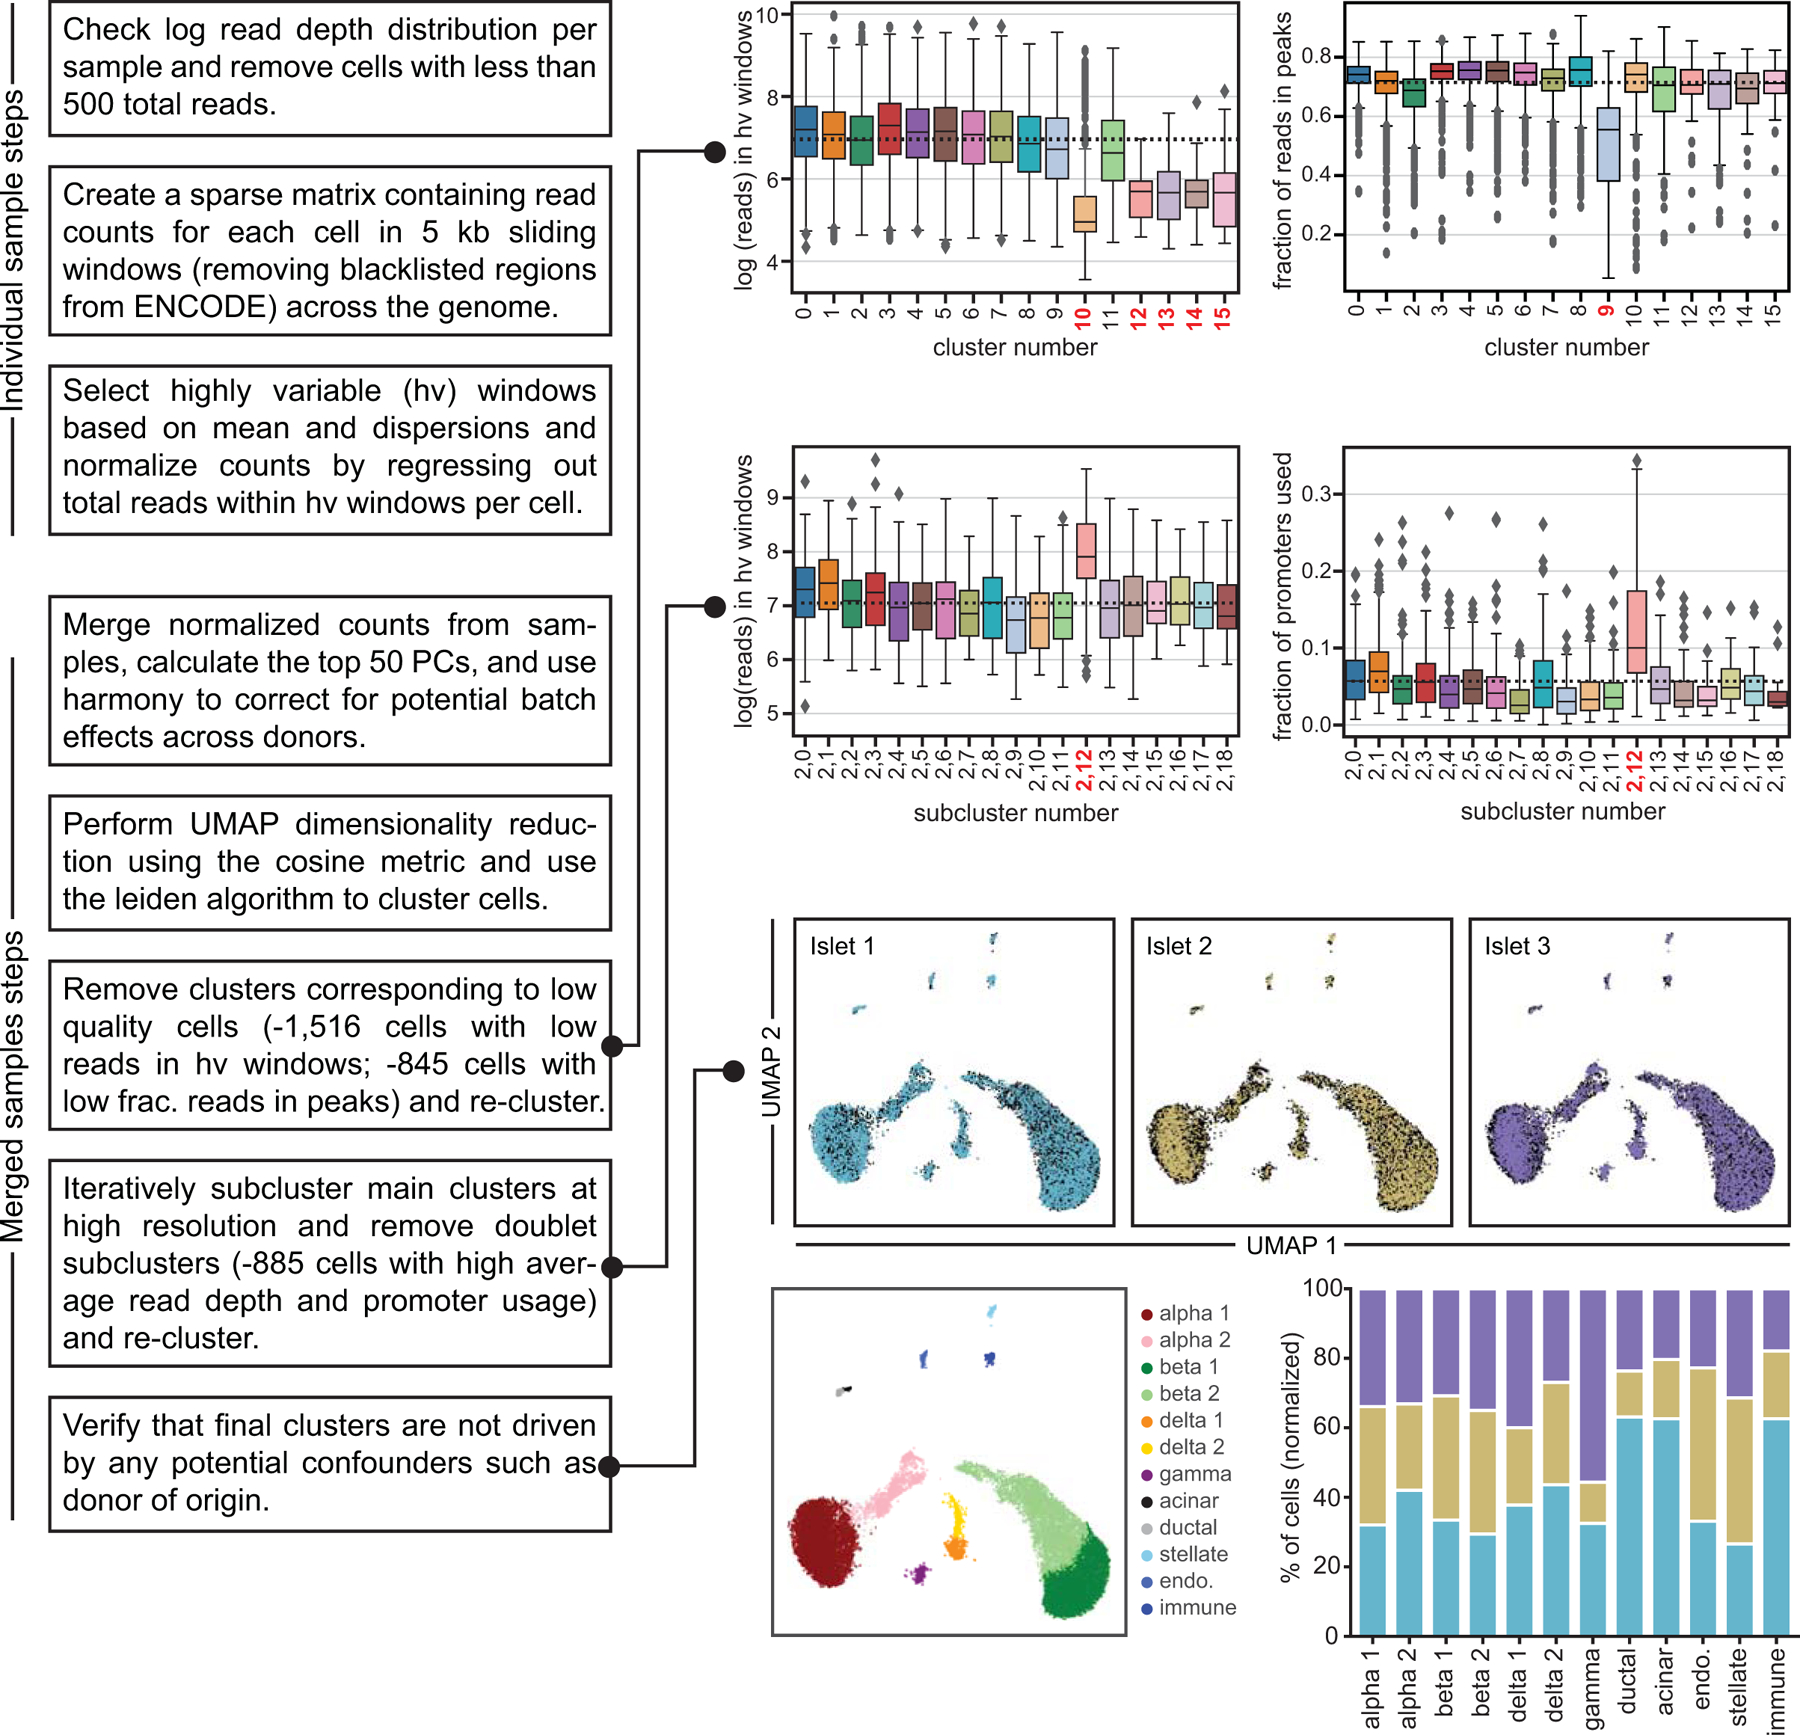
(a) Flowchart summarizing key steps of the snATAC-seq processing pipeline, including the various steps where cells were filtered out. Samples were first processed individually. All samples were then combined using a batch correction method. Clusters corresponding to cells from low quality cells, including those with low read depth in highly variable windows and low fraction of reads in peaks were then removed. After re-clustering, iterative subclustering of the main clusters at high resolution was used to identify and remove doublet subclusters. The final clusters are not driven by potential confounders such as donor of origin. Boxplot center lines, limits, and whiskers represent median, quartiles, and 1.5 IQR respectively.