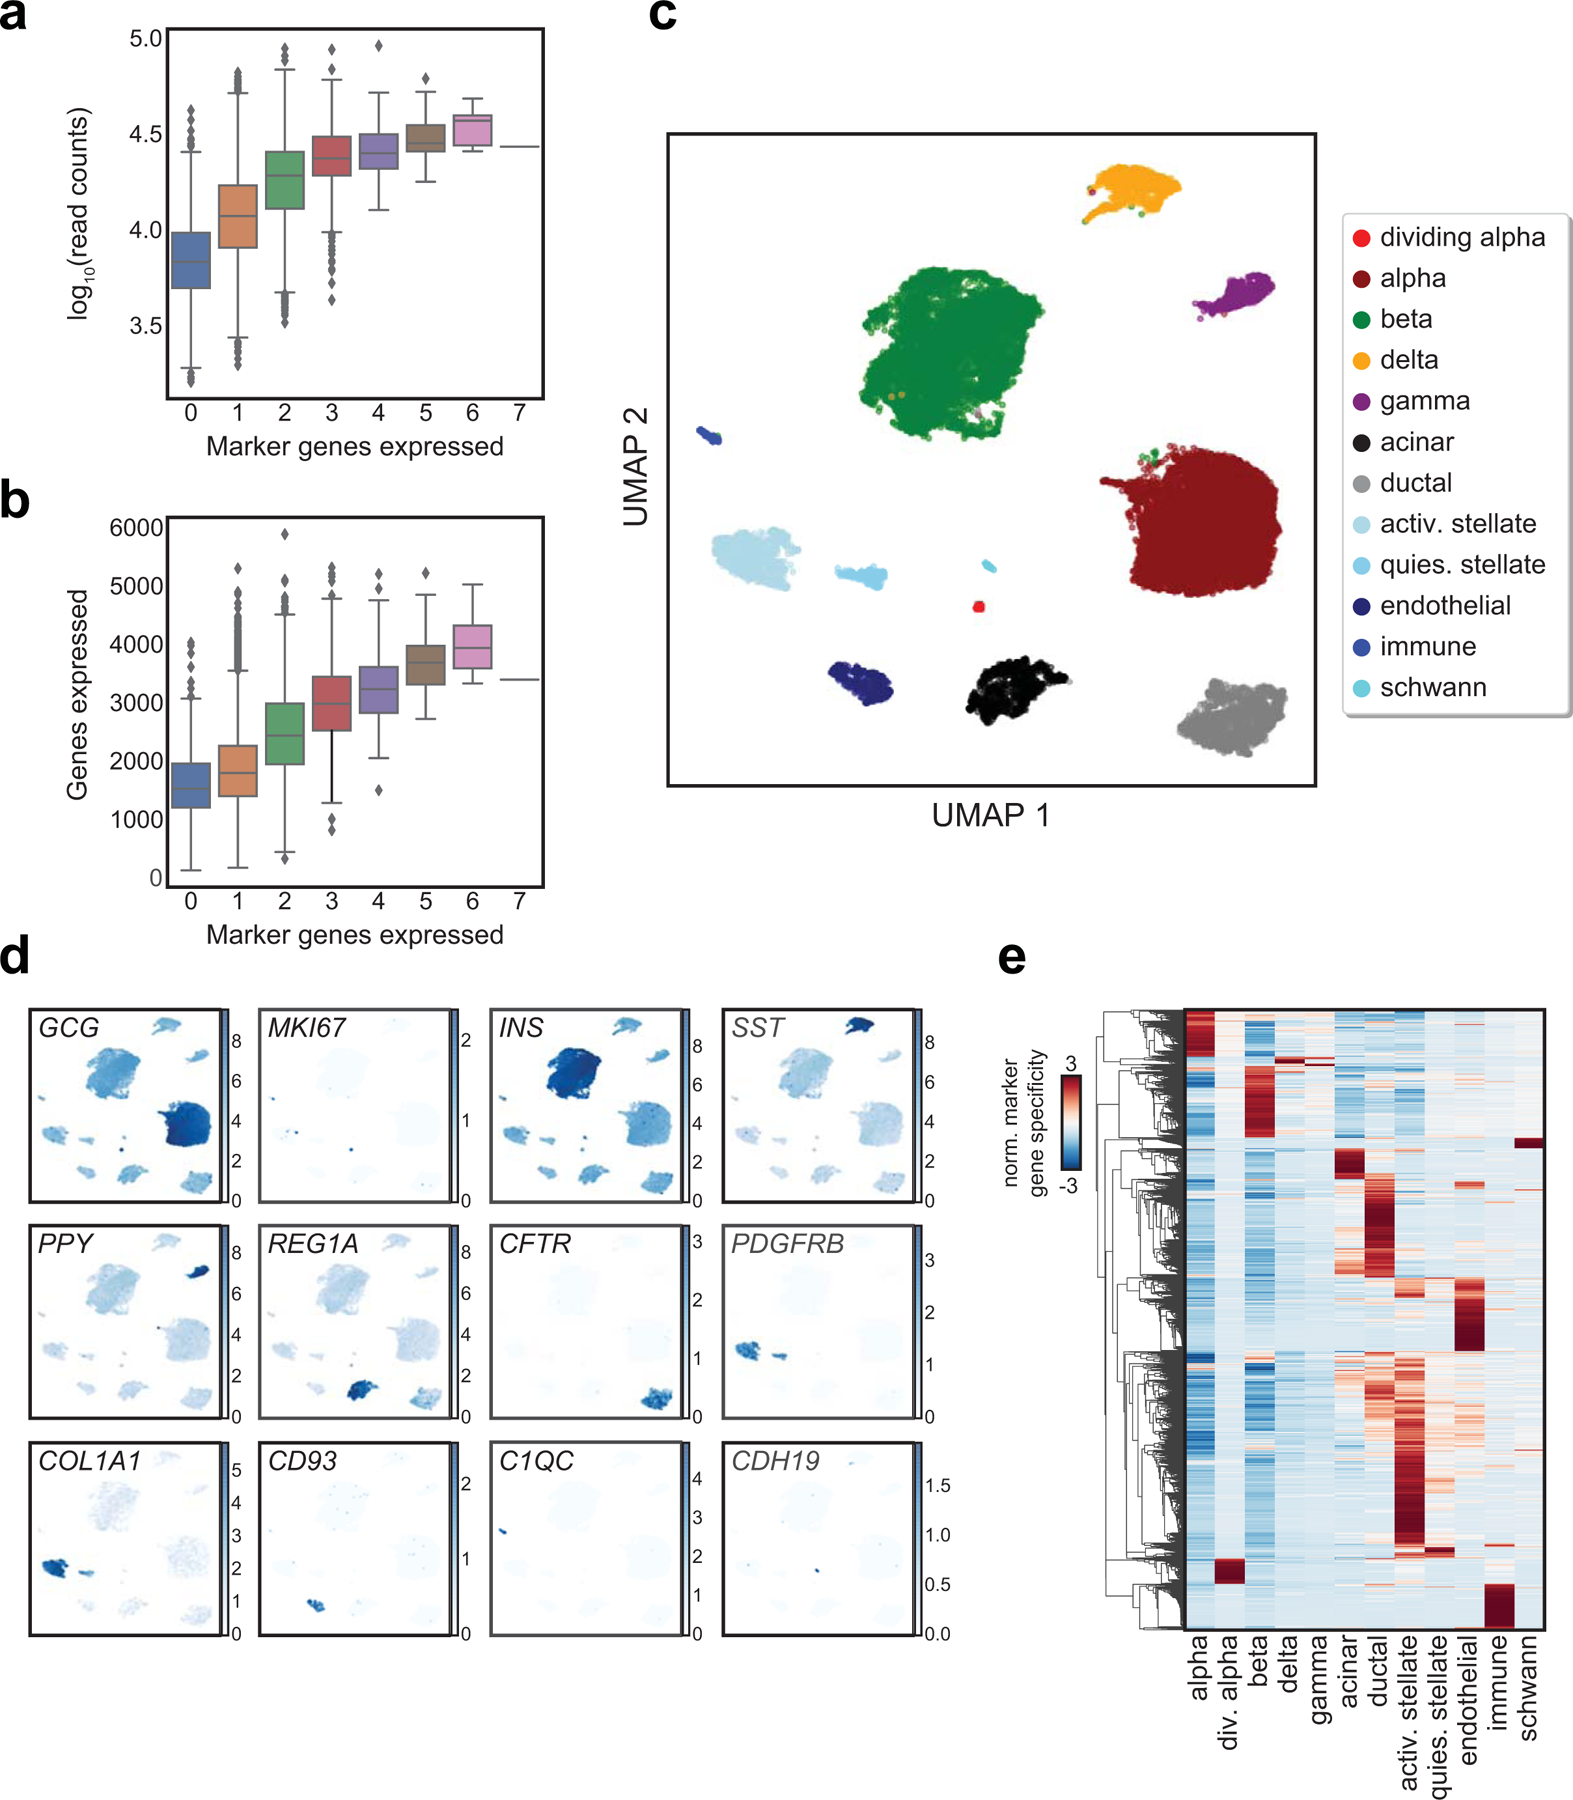
Extended Data Fig. 3. Analysis of islet single cell gene expression data.

(a) log10 transformed read depth or (b) total number of genes expressed compared with number of marker genes expressed per cell from scRNA-seq data. Boxplot center lines, limits, and whiskers represent median, quartiles, and 1.5 IQR respectively. Cells expressing more than one marker gene (defined by mixture models) were marked as doublets and filtered out. (c) Clusters of islet cells from single cell RNA-seq data plotted on UMAP coordinates. quies. stellate, quiescent stellate. activ. stellate, activated stellate. (d) Selected marker gene log2(expression) for each cluster plotted on UMAP coordinates. (e) Row-normalized t-statistics of marker gene specificity showing the most specific genes (t-statistic>20) for each cluster.
