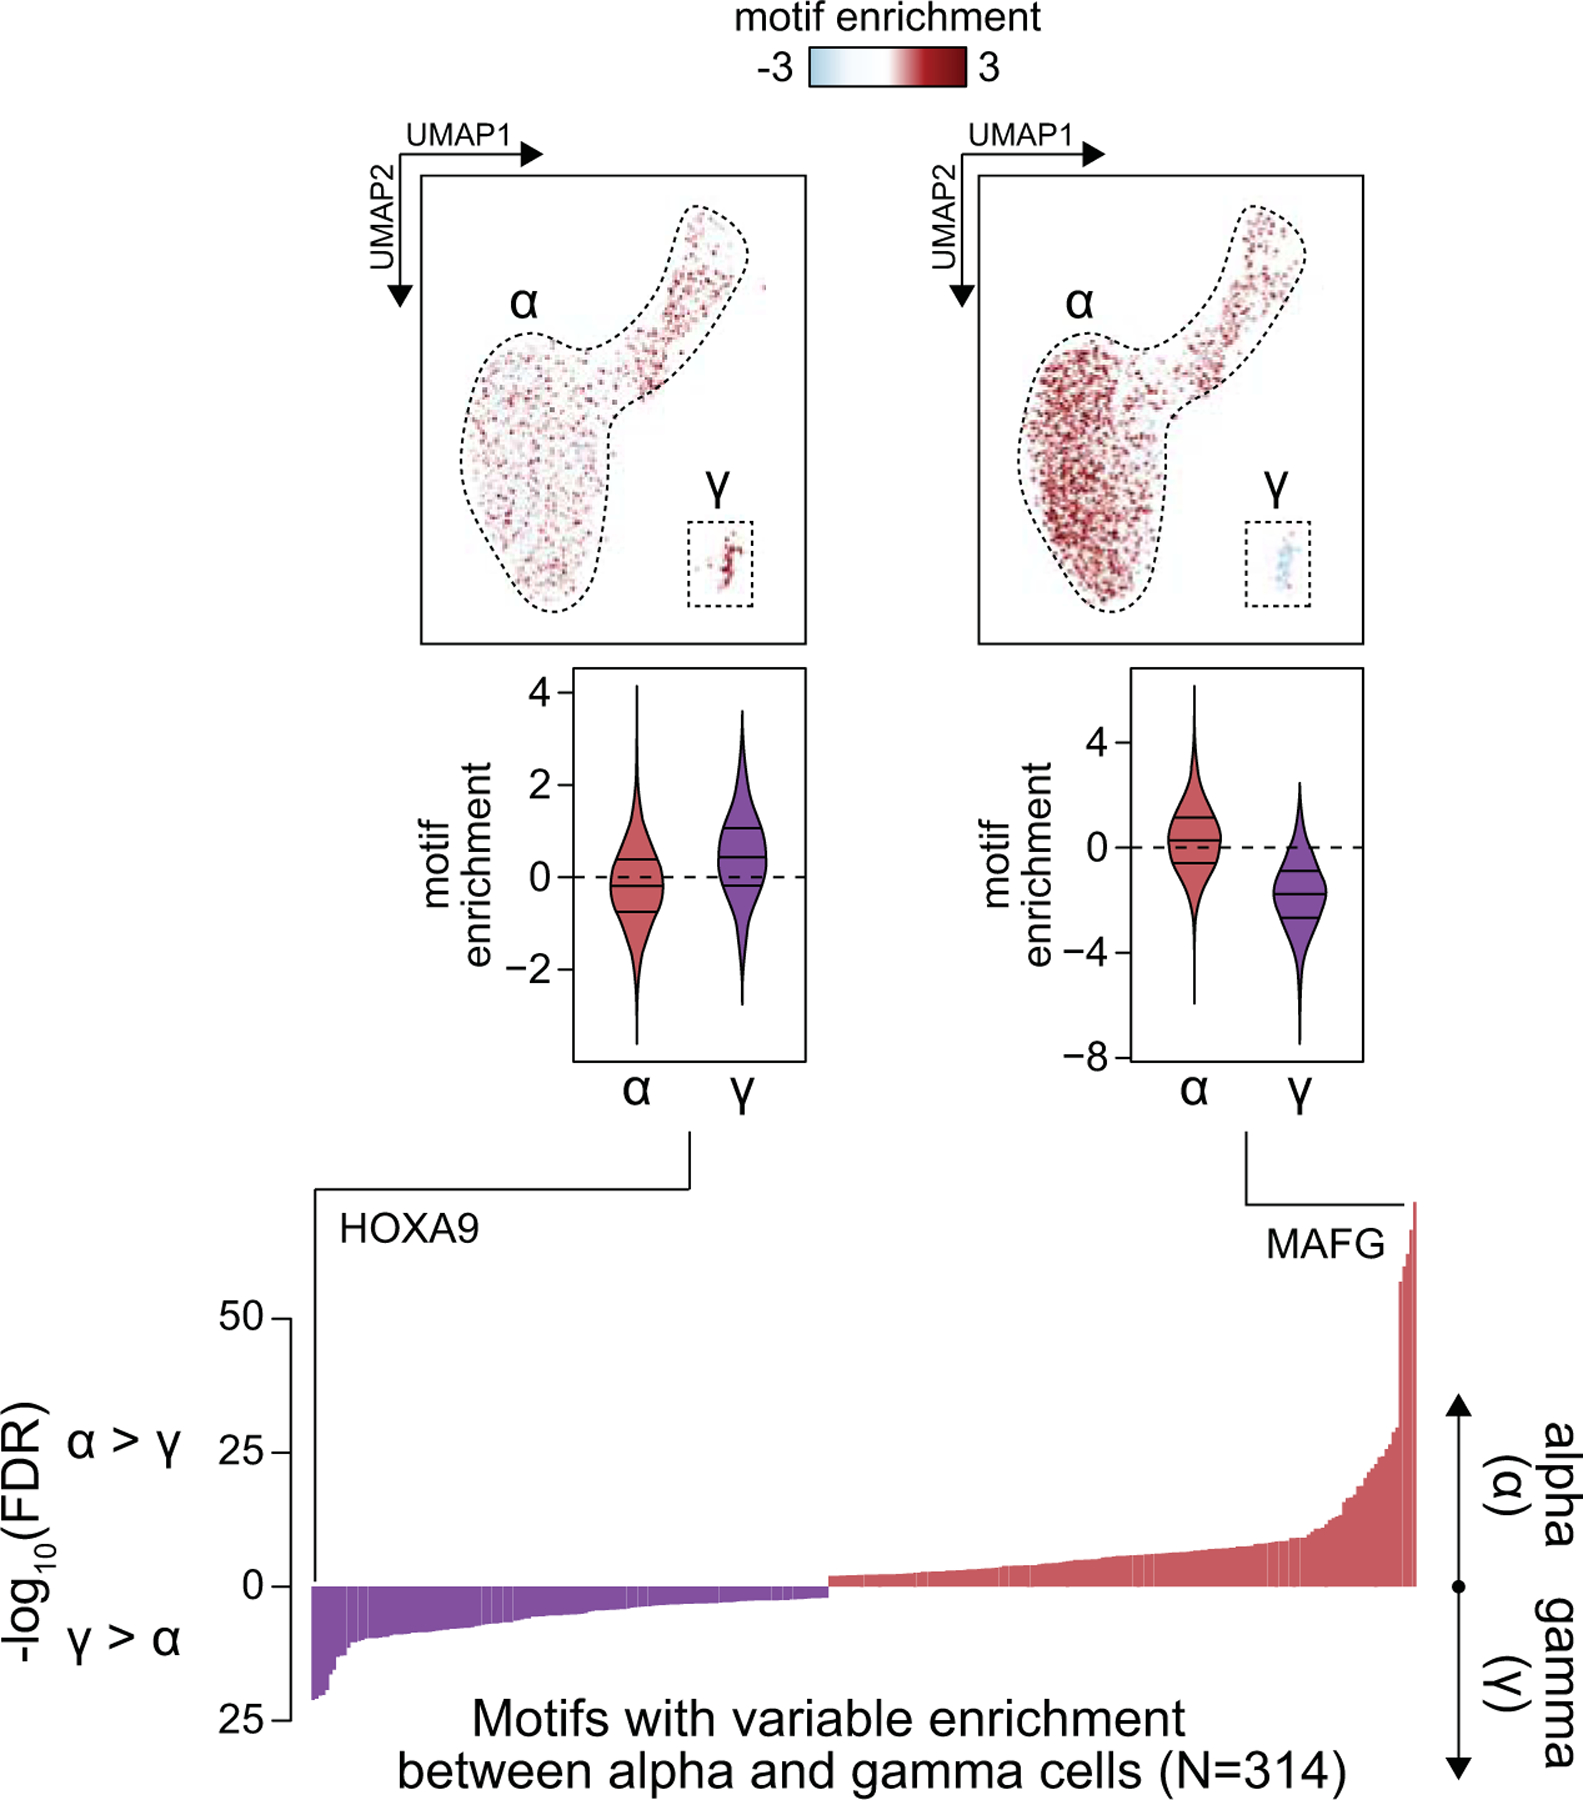
Extended Data Fig. 4. Comparison of motif enrichment between alpha and gamma cells.

Differential enrichment of motifs between alpha cell open chromatin regions and gamma cell open chromatin regions as measured by a 2-sided T-test, with FDR calculated by the Benjamini-Hochberg procedure. Examples are highlighted of motifs enriched in alpha cells and gamma cells, respectively (MAFG, HOXA9). UMAP plots show enrichment z-scores for the indicated motifs in alpha and gamma cells. Violin plots below show the distribution of enrichment z-scores across alpha or gamma cells, where the lines represent median and quartiles.
