Abstract
Epithelial-mesenchymal transition (EMT) programs operate within carcinoma cells in which they generate phenotypes associated with malignant progression. In their various manifestations, EMT programs enable epithelial cells to enter into a series of intermediate states arrayed along the E-M phenotypic spectrum. At present, we lack a coherent understanding of how carcinoma cells control their entrance into and continued residence in these various states, and which of these states favor the process of metastasis. Here, we characterize a layer of EMT-regulating machinery that governs E-M plasticity (EMP). This machinery consists of two chromatin-modifying complexes, PRC2 and KMT2D-COMPASS, that operate as critical regulators to maintain a stable epithelial state. Interestingly, loss of these two complexes unlocks two distinct EMT trajectories. Dysfunction of PRC2, but not KMT2D-COMPASS, yields a quasi-mesenchymal state that is associated with highly metastatic capabilities and poor survival of breast cancer patients, suggesting great caution should be applied when PRC2 inhibitors are evaluated clinically in certain patient cohorts. These observations identify epigenetic factors that regulate E-M plasticity, determine specific intermediate EMT states and, as a direct consequence, govern the metastatic ability of carcinoma cells.
INTRODUCTION
Recent advances in sequencing technologies have revealed the substantial impact of phenotypic diversification among the cancer cells within individual tumors 1–3, which is attributable to both genetic and epigenetic mechanisms 4,5. Phenotypic plasticity, which enables carcinoma cells to interconvert between alternative phenotypic states without concomitant underlying changes in their genomes, has been increasingly recognized as a major obstacle to the successful clinical management of high-grade malignancies, given its apparent roles in conferring resistance to existing therapies and in metastatic dissemination and colonization 6.
A key mechanism enabling carcinoma cell phenotypic plasticity is the epithelial-mesenchymal transition (EMT), a cell-biological program that operates epigenetically to drive epithelial cells into more mesenchymal cell states arrayed at various points along the epithelial (E) to mesenchymal (M) phenotypic axis 7,8. Accumulating evidence has demonstrated that induction of an EMT program facilitates carcinoma cell dissemination 9,10, entrance into stem-cell like states 11,12, and resistance to cell death induced through various therapeutic treatments 13–15 including those based on checkpoint immunotherapies 16–18.
EMT programs generate phenotypically diverse, quasi-mesenchymal cell states that can interconvert from one state to another 7,10,19–21. Insufficient recognition of the complexity and heterogeneity of EMT programs has created divergent views about the functional contributions of EMT programs to metastasis 22,23. The questions raised by these studies, however, have been largely addressed by more detailed in vivo cell tracing analysis and by recognition of the diversity of EMT-associated phenotypic states participating in cancer progression 8,24–27.
It remains a major challenge to understand the molecular controls regulating how carcinoma cells enter and dwell stably in one or another specific phenotypic state along the E-M spectrum. Cells may ensure their continued residence in a specific state through an elaborate network of self-sustaining autocrine regulatory loops involving a series of EMT-inducing secreted factors 28,29. A complementary mechanism might act more centrally and involve epigenetic controls that govern the responsiveness of cells to such extracellular signals and ensure ongoing, cell-heritable residence in one state or another 30,31. Many previous studies of these regulatory mechanisms have been performed using phenotypically heterogeneous cell populations, which has limited our ability to draw definitive depictions of precisely how carcinoma cells control their entrance into and continuous residence in various alternative intermediate states arrayed along the E-M spectrum – the focus of the work described below.
RESULTS
Epithelial cells show different degrees of EMP
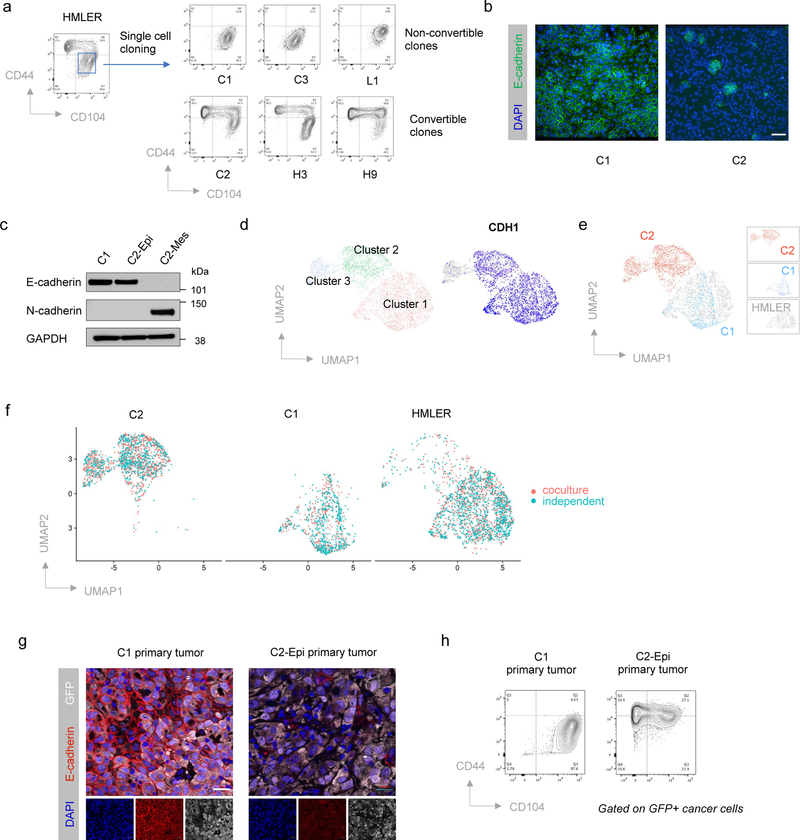
To understand determinants of EMP at the single-cell level, we generated a series of single-cell clones from the CD44lo, phenotypically epithelial subpopulation of HMLER cells; these cells represent an experimentally transformed human mammary epithelial cell model (Extended Data Fig. 1a–c) 32,33. Unexpectedly, these various single-cell clones exhibited dramatically different degrees of EMP. Thus, one group of HMLER epithelial single-cell-derived clones (31/40, 77.5%), like C1, stably maintained their epithelial status under in vitro culture conditions. In contrast, the cells from another group of HMLER epithelial single-cell clones (9/40, 22.5%), like C2, displayed extensive EMP and spontaneously generated CD44hi, more mesenchymal subpopulations (Fig. 1a–c and Extended Data Fig. 1d). Single-cell RNA-sequencing (scRNA-seq) analysis provided further indication that non-convertible and convertible epithelial clones belonged to two transcriptionally distinct subpopulations and that only convertible cells were able to spontaneously generate more mesenchymal progeny that have shed E-cadherin expression (Fig. 1d,e and Extended Data Fig. 1e).
Figure 1. HMLER epithelial cells contain two subpopulations with different EMP.
a, Flow cytometry of the CD44 and CD104 cell-surface staining showing six representative single cell clones isolated from HMLER CD44lo epithelial subpopulation. In the HMLER model, CD104 represents a marker expressing at epithelial state and getting gradually lost after cells entered CD44hi mesenchymal state. b, Immunofluorescent microscopy shows epithelial hallmark E-cadherin expression in in vitro cultured C1 and C2 cells. Scale bar, 20 μm. n = 3 biologically independent experiments. c, Immunoblot of E-cadherin, and N-cadherin in C1, C2-Epi (CD44lo) and C2-Mes (CD44hi) cells, GAPDH as loading control. n = 2 biologically independent experiments. d, Uniform Manifold Approximation and Projection (UMAP) plot of parental HMLER cells mixed with representative single cell clones C1 and C2. Expression levels of epithelial hallmark gene CDH1/E-cadherin were shown in the right panel. Clusters are assigned to indicate cell subpopulations by differentially expressed genes. e, Distribution of representative single cell clones in the UMAP plot shown in panel d. f, UMAP plots showing co-culture of C1, C2 and parental HMLER cells does not change their respective cell states and EMP. C1, C2 and parental HMLER cells were barcoded before co-culture and all cells were sequenced simultaneously. g, Immunofluorescence staining shows E-cadherin expression in the primary tumors initiated from C1 or C2-Epi cells. Scale bar, 20 μm. GFP represents tumor cells. Representative of n=3 biologically independent experiments. h. Flow cytometry of the CD44 and CD104 cell-surface staining of GFP+ cancer cells from primary tumors initiated from C1 or C2-Epi cells. Representative of n=3 biologically independent experiments.
Co-culture of C1, C2 and parental HMLER cells together did not change their respective degrees of EMP (Fig. 1f). When implanted in host mice, non-convertible C1 and convertible C2 cells maintained their respective EMP in vivo (Fig. 1g,h). These observations suggested that the ability of C1 cells to stably maintain their residence in an epithelial state was mediated by some type of cell-autonomous mechanism.
CRISPR screen identifies epigenetic regulators of EMP
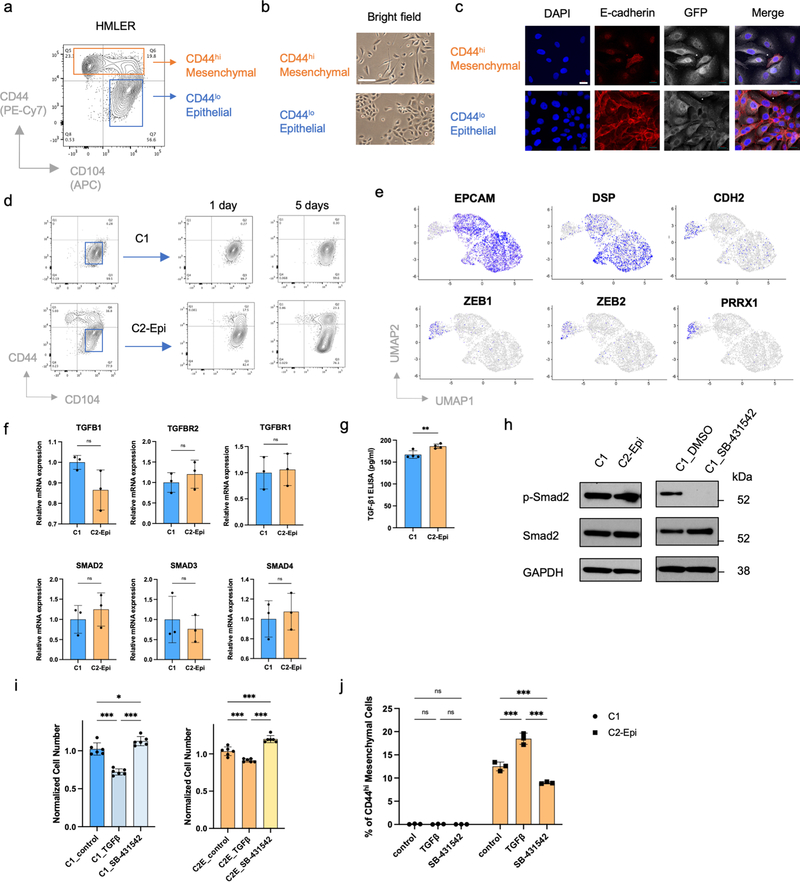
We sought to explore the molecular mechanisms underlying EMP and the lack thereof. Since the TGF-β signaling pathway has long been known to play a central role in activating EMT 28,29, we first examined whether the absence of EMP in C1 cells might be caused by defects in their responses to TGF-β. Indeed, ongoing autocrine TGF-β signaling and a TGF-β-induced cytostatic program were detected in both C1 and C2-Epi cells (Extended Data Fig. 1f–i). However, a TGF-β-induced EMT program could only be efficiently incited in C2-Epi cells (Extended Data Fig. 1j). These data demonstrated that heterogenous EMP of these carcinoma cells could not be ascribed to their differential abilities to receive and process TGF-β-triggered signals. Instead, the downstream responses of these cells to TGF-β signals clearly differed substantially.
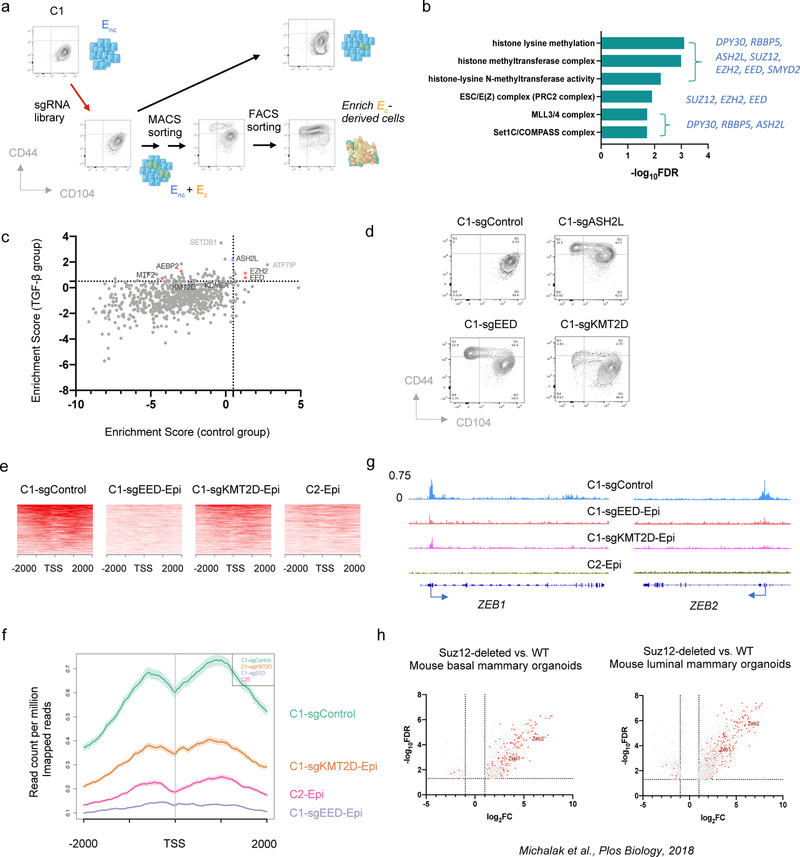
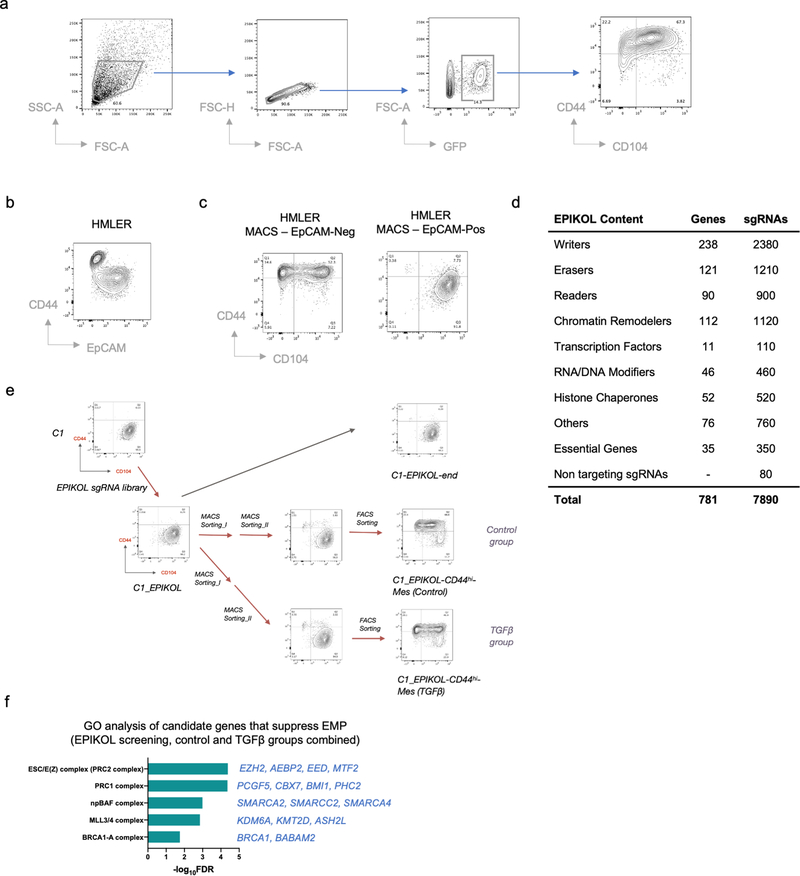
The stability of C1 cells residing in the epithelial state provided a useful model system for identifying genes that are essential to resist EMT-inducing signals. More specifically, we performed a genome-wide CRISPR/Cas9 knockout screen in these cells, using a library containing 187,535 single guide RNAs (sgRNAs) in a Cas9-expressing vector that was designed to target 18,663 distinct genes in the human genome 34 (Fig. 2a and Extended Data Fig. 2a–c). A mesenchymal cell population arose from cells that had been transduced with the sgRNA library, which we isolated and then sequenced to identify enriched sgRNAs (see Methods). As we found, 93 genes appeared to encode potential guardians of stable residence in the epithelial state. Gene ontology (GO) analysis of these genes revealed that PRC2 and COMPASS –– two multi-subunit, epigenetic regulatory complexes –– were the only encoded cellular components that were significantly enriched among this cohort of genes (FDR < 0.05) (Fig. 2b).
Figure 2. CRISPR screening identifies PRC2 and KMT2D-COMPASS as regulators of EMP.
a, Diagram of the CRISPR screening using non-convertible C1 cells to identify potential regulators of EMP. Enc, non-convertible epithelial cells. Ec, convertible epithelial cells. b, List of GO terms that were enriched in identified genes from the genome-wide CRISPR screening as guardians of the stable epithelial state. c, Plot showing the enrichment scores of genes examined using the EPIKOL CRISPR screening. Red and Purple dots indicate PRC2 and KMT2D-COMPASS components respectively. d, Flow cytometry analysis of the CD44 and CD104 cell-surface staining of single cell clones of C1-derived cells with control guide RNA or complete knock-out of ASH2L, EED or KMT2D genes. e, Heatmap displaying PRC2 occupancy (as measured by EZH2 CUT&RUN profiles) at gene promoters in C1-sgControl, C1-sgEED-Epi, C1-sgKMT2D-Epi and C2-Epi cells. 998 identified PRC2 direct target genes were shown in the plots. f, Average binding intensity of PRC2 in the promoter region of identified targets in C1-sgControl, C1-sgEED-Epi, C1-sgKMT2D-Epi and C2-Epi cells. The error bands represent the standard error of mean. g, Status of PRC2 occupancy at the promoters of EMT-TF genes ZEB1 and ZEB2, signal quantified as counts per million mapped reads. h, ZEB1 and ZEB2 were up-regulated in mouse epithelial cells after PRC2 core component SUZ12 knock-out. Red dots represent genes identified as PRC2 direct targets in HMLER-C1 cells. Numerical source data are provided.
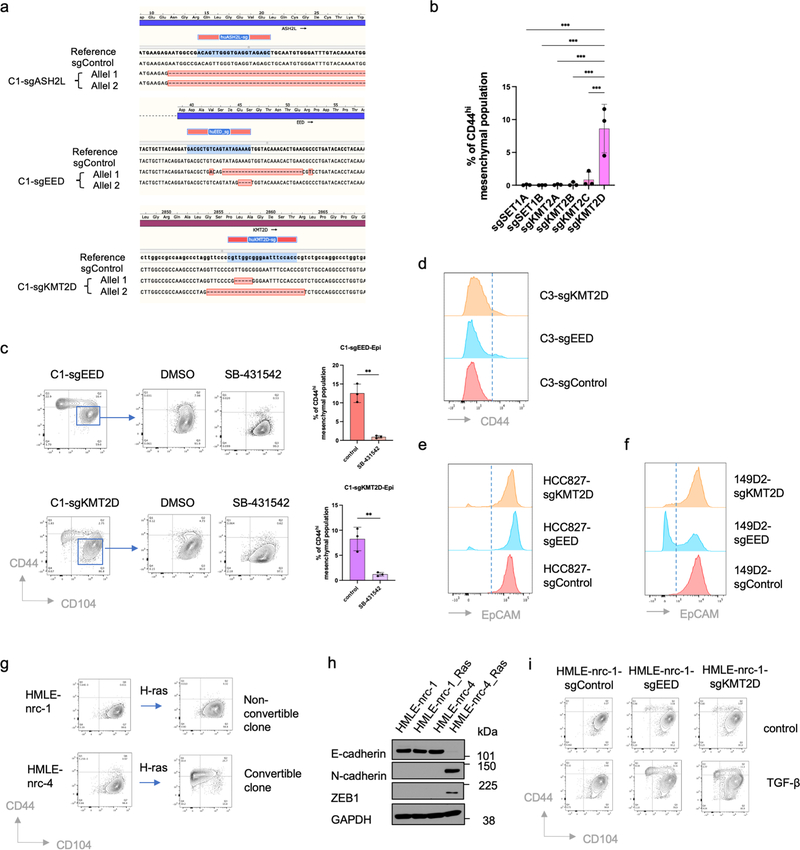
Based on these initial results, we proceeded to perform a more focused CRISPR screen employing an sgRNA library (EPIKOL) targeting only genes encoding epigenetic regulators (Extended Data Fig. 2d,e) 35. In this instance, we again found that sgRNAs targeting the EZH2 and EED genes (encoding two components of the PRC2 complex) as well as the ASH2L gene (encoding a COMPASS component) were enriched in the emerging mesenchymal populations (Fig. 2c and Extended Data Fig. 2f). These results provided confirmatory evidence that PRC2 and COMPASS complexes operate as critical barriers to EMP in the epithelial cells under study. When the genes encoding the EED and ASH2L subunits of these complexes were individually knocked out, we confirmed that the resulting C1-sgEED and C1-sgASH2L cells had indeed acquired EMP and transited spontaneously into a CD44hi more mesenchymal state (Fig. 2d and Extended Data Fig. 3a).
In mammalian cells, there are six functionally non-redundant, independently acting complexes of the COMPASS family, containing six alternative H3K4 methyltransferases 36. Our secondary CRISPR screening identified one of these six alternative methyltransferases, KMT2D, as a potential regulator of EMP (Fig. 2c). We further confirmed that among these six alternative methyltransferases, only KMT2D played a major role in governing EMP (Extended Data Fig. 3b). As we also found, treatment with SB-431542, a pharmacologic inhibitor of the TGF-β receptor largely prevented both epithelial C1-sgEED and C1-sgKMT2D cells from converting spontaneously into a CD44hi more mesenchymal cell state (Extended Data Fig. 3c). This suggested that in the derivatives of C1 cells that had gained plasticity, autocrine TGF-β signaling was indeed required for their E-to-M conversion.
We also found that the essential role of PRC2 and KMT2D-COMPASS in maintaining an epithelial cell state was not an idiosyncrasy to the C1 cells. Thus, knocking-out key components of these two complexes in C3 cells, a second independently arising non-convertible epithelial HMLER single-cell clone, in HCC827 cells, a phenotypically epithelial human non-small cell lung cancer cell line, in SUM149D2 cells, an epithelial subclone of the human SUM149 triple-negative breast cancer cell line, and in immortalized but untransformed HMLE cells, all yielded EMP, i.e., resulted in spontaneous activation of EMT programs (Extended Data Fig. 3d–i).
PRC2 constrains transcription of certain EMT-TF genes
We explored in more detail the molecular mechanisms that might explain the acquired EMP of cells that have lost components of PRC2 or KMT2D-COMPASS complexes. PRC2 has been shown to catalyze di- and tri-methylation of the lysine 27 residue of histone 3 (H3K27me2/3), facilitating the formation of facultative heterochromatin and thereby suppressing transcription 37. KMT2D-COMPASS, for its part, implements and maintains methylation of the K4 residue of histone H3 at enhancer and promoter regions, resulting instead in activation of gene expression 38,39. To understand how these two ostensibly conflicting histone-modifying complexes regulate EMP, we utilized the Cleavage Under Targets and Release Using Nuclease (CUT&RUN) sequencing procedure 40 to identify direct genomic targets of PRC2 and KMT2D-COMPASS in the non-convertible epithelial cells.
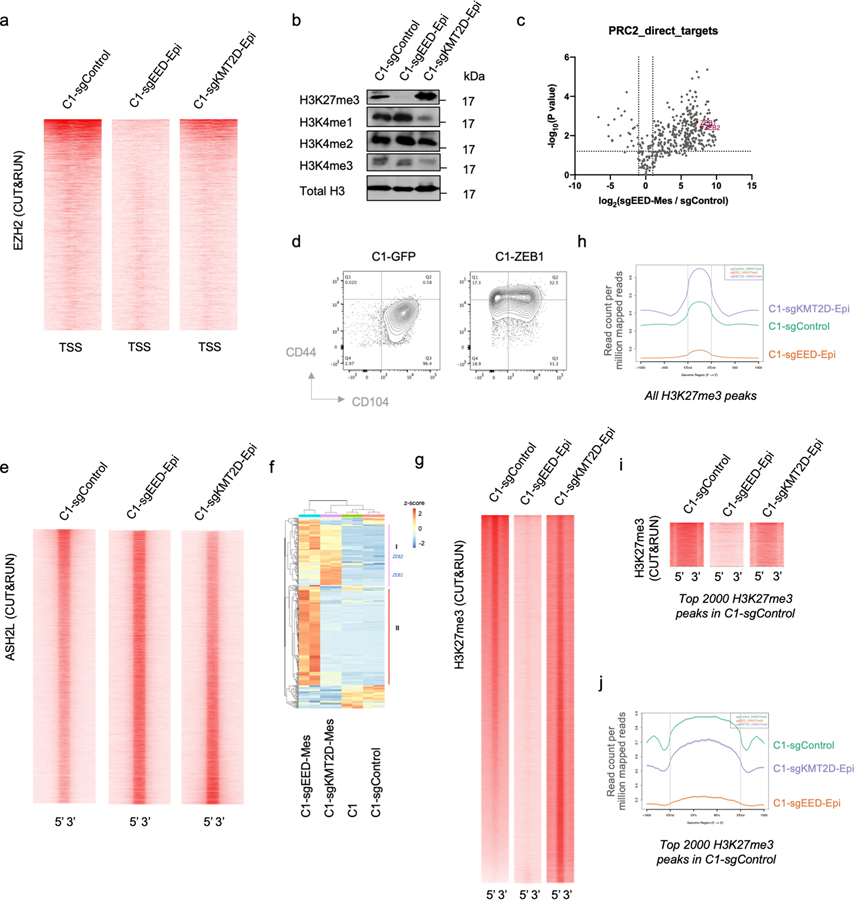
As we found, knock-out of the gene encoding the EED subunit of PRC2 resulted in a global reduction of PRC2 genomic binding and H3K27me3 levels (Extended Data Fig. 4a,b). By comparing C1-sgControl vs. C1-sgEED cells, we identified 998 bona fide PRC2 target genes whose promoter binding was eliminated by knocking out EED (Fig. 2e, f). 413 of the 998 identified target genes were expressed in C1-sgControl or C1-sgEED cells and 68.5% of them (283/413) showed significant up-regulation (FC>2, p<0.05) in response to EED knock-out (Extended Data Fig. 4c). We noted that several identified PRC2 target genes were known to encode master regulators of the EMT program (EMT-TFs), including notably ZEB1 and ZEB2 (Fig. 2g). In fact, when ectopically expressed in C1 initially unconvertible cells, ZEB1 suffices on its own to induce an EMT program (Extended Data Fig. 4d). This suggested that PRC2 stably maintains residence of cells in an epithelial state in part by directly binding to the gene encoding this key EMT-TF. Consistently, ZEB1 and ZEB2 were up-regulated in PRC2-KO normal mouse mammary epithelial cells (Fig. 2h) 41, indicating that it is an evolutionarily conserved function of the PRC2 complex to constrain the expression of these EMT-TFs and thereby maintain epithelial homeostasis.
Knocking-out KMT2D, in contrast, had minimal effects in changing the genomic binding of COMPASS complexes (Extended Data Fig. 4e). However, we found a general decrease of PRC2 binding to its targets upon KMT2D knock-out; for a subset of these targets including ZEB1 and ZEB2, PRC2 binding was almost eliminated in KMT2D-KO cells and resulted in de-repression of their expression (Fig. 2e, f and Extended Data Fig. 4f). The change of PRC2 binding in KMT2D-KO cells is consistent with a global change of the H3K27me3 mark distribution in these cells; thus, many previously present H3K27me3-positive regions in parental C1 cells showed lower signal while other regions gained H3K27me3 marks (Extended Data Fig. 4g–j). Nevertheless, the loss of PRC2 binding to the promoter of genes encoding ZEB1 and ZEB2 EMT-TFs is shared by the experimentally modified C1-sgEED, C1-sgKMT2D and the spontaneously arising C2 plastic epithelial cells (Fig. 2g), providing a compelling mechanistic explanation of elevated EMP in these cell populations.
Loss of PRC2 and KMT2D-COMPASS unlocks two EMT trajectories
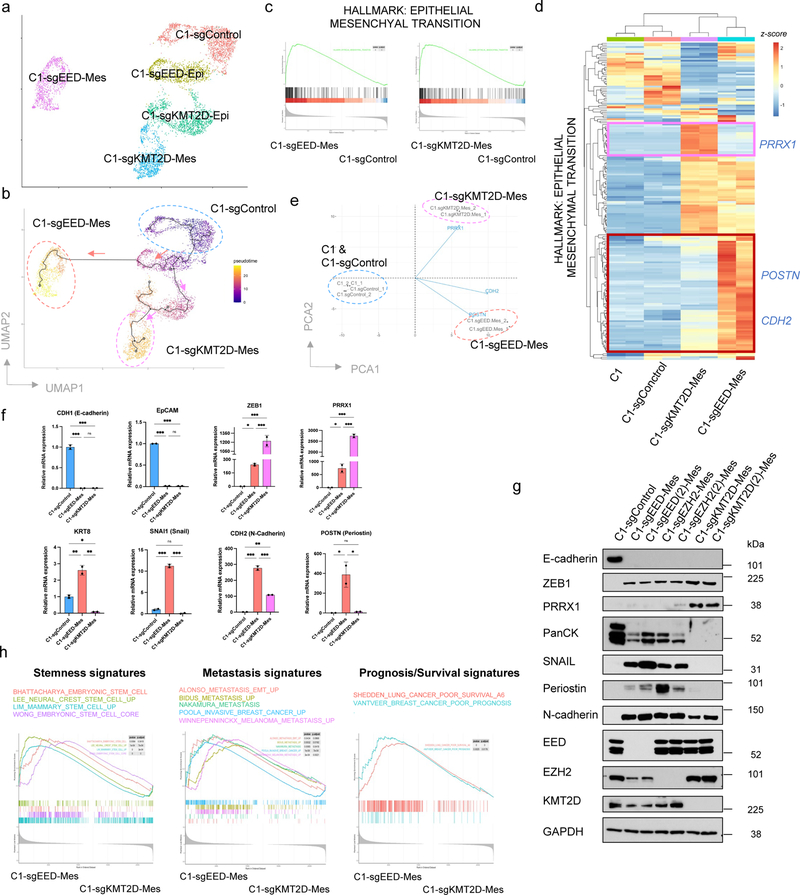
Interestingly, scRNA-seq analysis revealed that the more mesenchymal cells generated by EED and KMT2D knockouts bore distinct transcriptomes (Fig. 3a and Extended Data Fig. 5a), raising the possibility that EED-KO and KMT2D-KO mesenchymal cells reside at different positions along the E-M phenotypic spectrum. Since C1-parental, C1-sgEED and C1-sgKMT2D cells were all derived from one single cell clone, we utilized single-cell trajectory analysis 42 to construct transitioning path(s) in order to map how the more mesenchymal end-states were reached. Interestingly, this analysis revealed that distinct EMT programs had been activated following the gene knockouts directed by these sgRNAs, yielding cells that landed in two distinct mesenchymal cell states (Fig. 3b).
Figure 3. Knocking-out PRC2 or KMT2D-COMPASS generates two distinct (quasi-)mesenchymal cell states.
a, UMAP plot showing different clusters of C1-sgControl, C1-sgEED and C1-sgKMT2D cells. b, Cell trajectory analysis revealed knocking-out EED and KMT2D specified two distinct EMT subprograms. Colors represent pseudotime along the learned trajectories, rooted in epithelial C1-sgControl cells. c, GSEA analysis showing the Hallmark EMT gene set was enriched in both C1-sgEED-Mes and C1-sgKMT2D-Mes cells compared with C1-sgControl cells. d, Heatmap of RNA-seq data, showing expression patterns of genes within the Hallmark EMT gene set in parental C1, C1-sgControl C1-sgEED-Mes, and C1-sgKMT2D-Mes cells. e, PCA analysis of samples examined in panel d, using all the genes within the Hallmark EMT gene set. Three representative genes including PRRX1, CDH2 and POSTN were shown for their contribution to determine the PCA plot. f, mRNA levels of EMT-TF genes SNAI1, ZEB1, PRRX1 and EMT marker genes CDH1, EPCAM, KRT8, CDH2 and POSTN showed different expression patterns in C1-sgControl, C1-sgEED-Mes and C1-sgKMT2D-Mes cells. n=2. *, p < 0.05; **, p < 0.01; ***, p < 0.001. n.s., not significant. Statistical analysis was performed using one-way ANOVA followed by Tukey multiple-comparison analysis. Data are presented as mean ± SEM. g, Immunoblot of EMT-TFs SNAIL, ZEB1, PRRX1, EMT marker genes E-cadherin, pan-cytokeratines, N-cadherin and periostin and EED, EZH2, KMT2D in C1-sgControl, C1-sgEED-Mes, C1-sgEZH2-Mes and C1-sgKMT2D-Mes cells. C1-sgEED(2)-Mes, C1-sgEZH2(2)-Mes, C1-sgKMT2D(2)-Mes were generated using alternative guide RNAs targeting different genomic segments of their corresponding genes. n = 2 biologically independent experiments. h, GSEA analysis showing C1-sgEED-Mes cells were enriched for multiple transcriptional signatures associated with stemness, elevated metastasis and poor prognosis. Numerical source data are provided.
To better characterize cellular products of these two distinct knockout-activated EMT programs, we examined the bulk RNA-seq profiles of the more mesenchymal cells generated by EED and KMT2D knockouts in order to include transcripts that were expressed at relatively low levels. Here we found that the transcriptomes of EED-KO and KMT2D-KO mesenchymal cells were both enriched for the Hallmark EMT gene set (Fig. 3c). Nonetheless, they differed in the expression patterns of certain genes within this shared signature (Fig. 3d,e). For example, mesenchymal cells generated by EED-KO retained certain epithelial features such as the expression of cytokeratins (Fig. 3f,g) and thus reside in a cell state that we term “quasi-mesenchymal”. They also expressed significantly elevated levels of POSTN and CDH2, both of which have been shown to be functionally essential for breast cancer metastasis 26,43, as well as the gene encoding the SNAIL EMT-TF, which is associated with stemness and poor prognosis in cancer patients 44–46 (Fig. 3d–g). Similar to knocking out the gene encoding the EED component of the PRC2 complex, knocking out EZH2, the catalytic subunit of this complex also generated cells that entered a quasi-mesenchymal state (Fig. 3g).
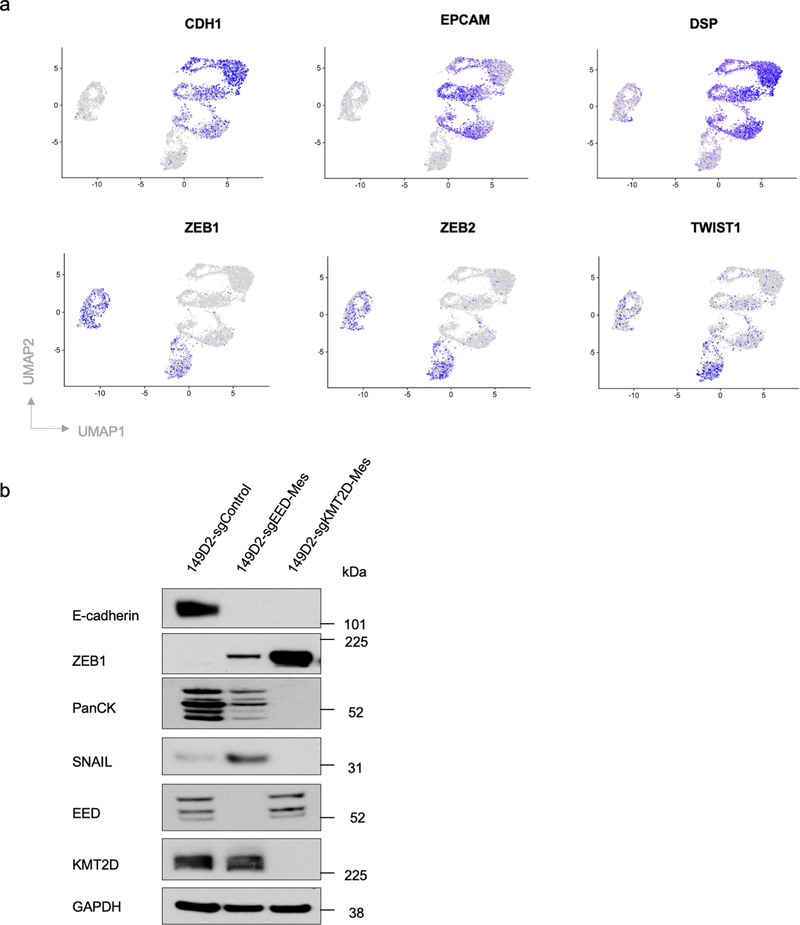
A contrasting outcome was observed in cells that had suffered knockout of the gene encoding KMT2D; the analyses revealed that the resulting cells migrated to a highly mesenchymal state. Compared with EED-KO quasi-mesenchymal cells, KMT2D-KO highly mesenchymal cells did not express cytokeratins but expressed higher level of the EMT-TF-encoding gene PRRX1, which has been shown to associate with a highly mesenchymal cell state and to serve as a good prognostic marker in cancer patients 44. Similarly, knockout of EED in SUM149D2 cells generated quasi-mesenchymal cells, which differed from the highly mesenchymal state generated via KMT2D knockout (Extended Data Fig. 5b).
Consistent with the notion that aggressive, stem-like characterizations are associated with a quasi-mesenchymal but not highly mesenchymal state 7,10,12,19, the transcriptome of EED-KO quasi-mesenchymal cells was significantly enriched for multiple signatures associated with stemness, as well as those associated with elevated metastasis and poor prognosis (Fig. 3h).
PRC2 dysfunction elevated metastatic abilities
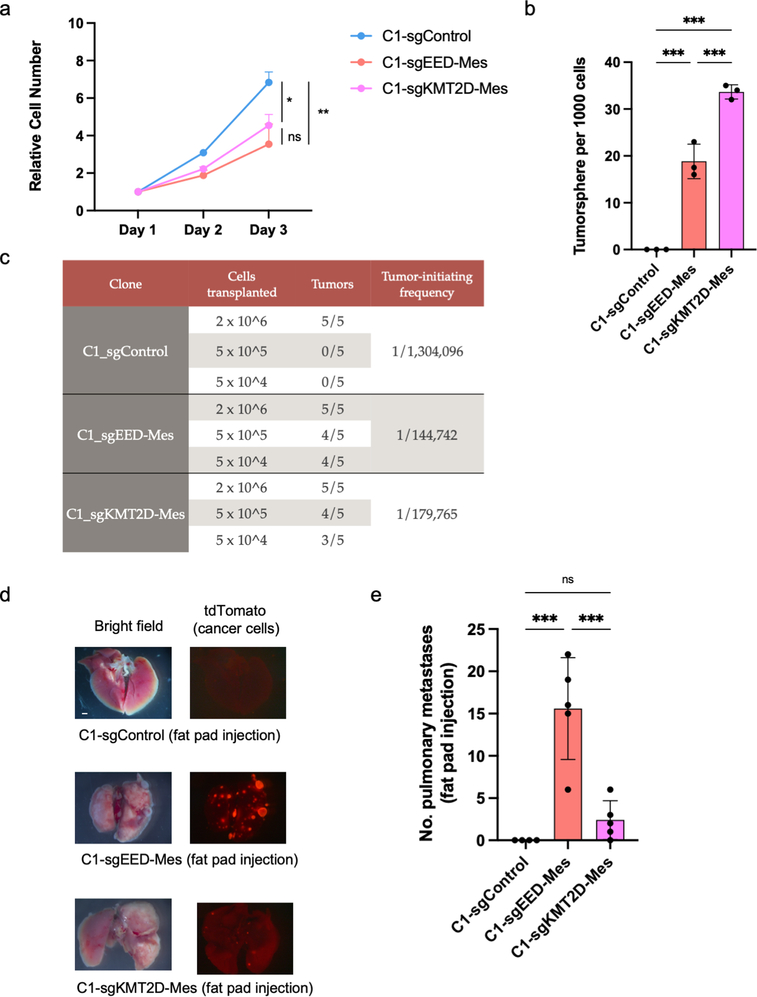
To confirm functionally that the EED-KO quasi-mesenchymal cells indeed exhibited cancer stem cell properties and an elevated metastatic potential, we compared the control epithelial C1 cells, EED-KO quasi-mesenchymal and KMT2D-KO highly mesenchymal cells for their respective abilities to form primary tumors and lung metastases. Relative to epithelial C1 cells, both EED-KO and KMT2D-KO mesenchymal cells displayed modest reduction in cell proliferation but an increased ability to form tumorspheres in vitro and a higher tumor-initiating cell frequency in vivo (Extended Data Fig. 6a–c). However, there was no significant difference between these two mesenchymal states in their respective abilities to form primary tumors (Extended Data Fig. 6c).
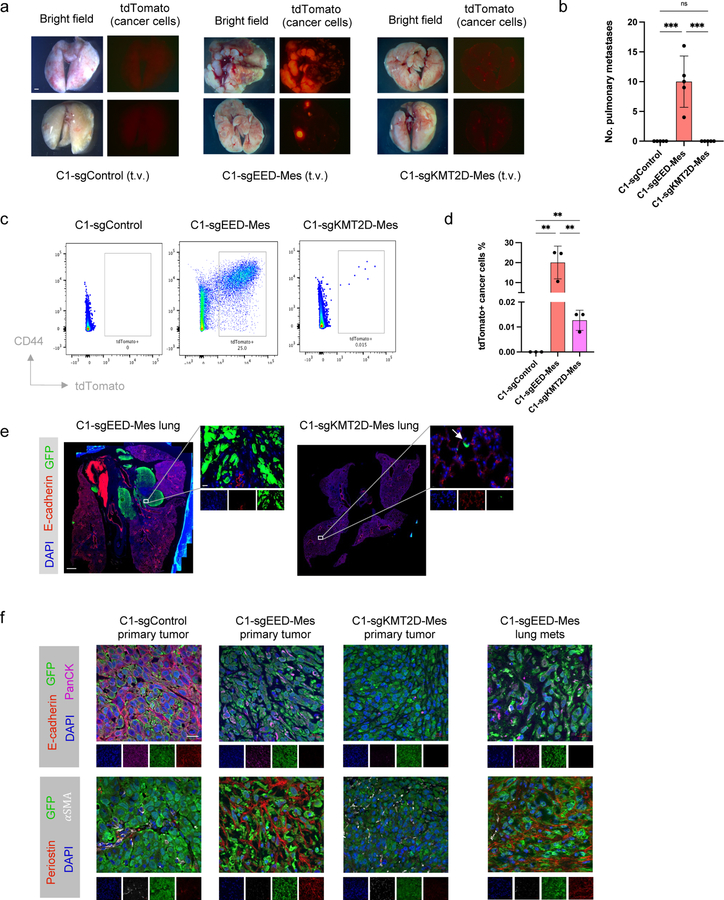
Strikingly, however, we found that these two cell populations behaved differently upon tail-vein injection, which gauges the abilities of disseminated cells to extravasate and colonize lung tissue, these representing the last steps of the invasion-metastasis cascade 9. Thus, only EED-KO quasi-mesenchymal cells were able to form macrometastases in the lung, while neither the epithelial control C1 cells nor KMT2D-KO highly mesenchymal cells could do so (Fig. 4a,b). Different from parental C1 cells, some of the disseminated KTM2D-KO highly mesenchymal cells were able to survive at distant sites in a dormant form six weeks after cell injection (Fig. 4c–e). We also found that EED-KO cells remained in an E-cadherin negative state in the lung metastases, indicating it was not necessary for them to revert back to a fully epithelial state in order to form macrometastases (Fig. 4e,f). In addition, EED-KO quasi-mesenchymal cells were capable of spontaneously forming macrometastases in the lung from orthotopic primary tumors, demonstrating their ability to complete the entire invasion-metastasis cascade (Extended Data Fig. 6d,e). These results provided direct evidence that these phenotypic states generated by the two distinct EMT subprograms had distinct abilities of metastatic colonization.
Figure 4. EED-KO quasi-mesenchymal cells and KMT2D-KO highly mesenchymal cells show different abilities of metastatic colonization.
a,b, Representative bright-phase and fluorescence microscopy (a) and number of metastatic nodules (b) showing metastatic outgrowths in the lung of C1-sgControl, C1-sgEED-Mes and C1-sgKMT2D-Mes cells 6 weeks after tail vein injection. n=5 in each group. ***, p<0.001. n.s., not significant. Scale bar, 1000 μm. c, d, Representative data from flow cytometry analysis (c) and quantification (d) of tdTomato+ (cancer cells) in mouse lung tissue 6 weeks after intravenous cell inoculation. CD45+ and CD31+ stromal cells were removed by MACS sorting before analysis. n=3 biologically independent experiments. **, p = 0.005. e, Representative pictures of mouse lung tissues showing metastases initiated by C1-sgEED-Mes cells and dormant C1-sgKMT2D-Mes cells. Scale bar, 1000 μm (whole lung section) and 20 μm (insert). n = 5 biologically independent experiments. f. Immunofluorescence staining shows expression of GFP (cancer cells), pan-cytokeratin, E-cadherin, periostin and α-SMA in the primary tumor initiated by C1-sgControl, C1-sgEED-Mes and C1-sgKMT2D-Mes cells and lung metastases initiated by C1-sgEED-Mes cells. Scale bar, 20 μm. n = 3 biologically independent experiments. Statistical analysis was performed using one-way ANOVA followed by Tukey multiple-comparison analysis. Data are presented as mean ± SEM. Numerical source data are provided.
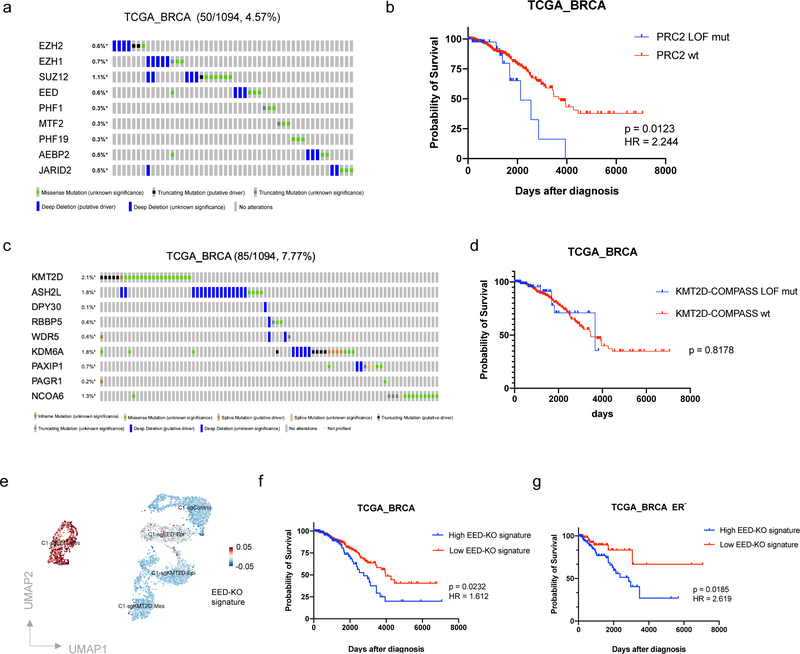
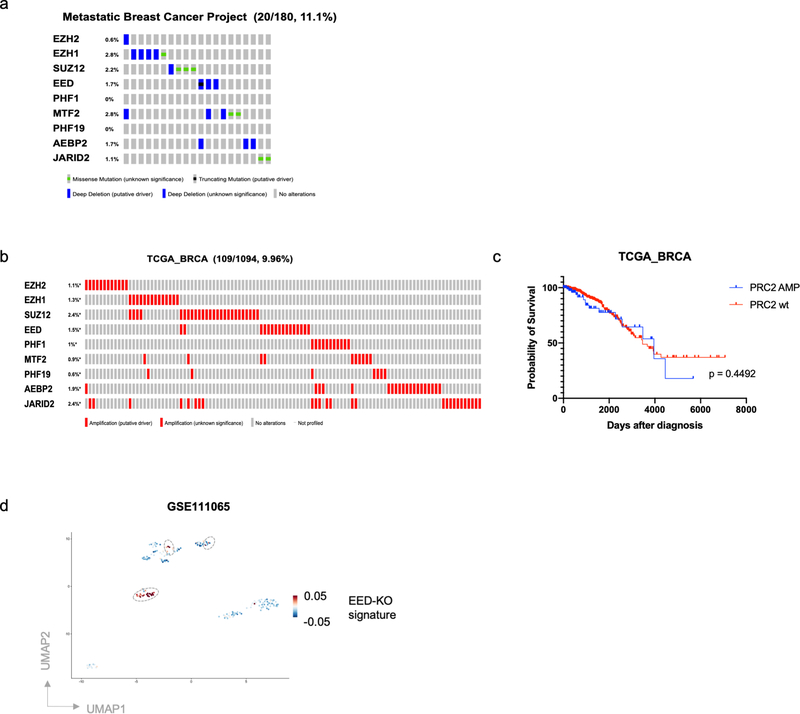
We next examined the consequences of PRC2 loss in the tumors borne by human breast cancer patients. To do so, we analyzed The Cancer Genome Atlas (TCGA) collection of bulk primary breast cancer and discovered a group of patients (4.57%) that harbored homozygous deletion or loss of function (LOF) mutations of PRC2 component genes (Fig. 5a). The percentage of patients harboring such mutations is higher in the cohort of Metastatic Breast Cancer Project (11.1%), in which all the patients developed metastatic disease (Extended Data Fig. 7a). Importantly, breast cancer patients bearing PRC2 LOF mutations displayed significantly worse prognosis compared with PRC2 wild-type patients (log-rank test p = 0.0123, Hazard Ratio = 2.244) (Fig. 5b). In contrast, while a group of patients (9.96%) was identified harboring amplification of PRC2 component genes, this group of patients did not show significant difference in their survival (Extended Data Fig. 7b,c). Moreover, breast cancer patients harboring LOF mutations of KMT2D-COMPASS component genes showed a prognosis and clinical progression similar to that of KMT2D-COMPASS wild-type patients (Fig. 5c,d).
Figure 5. PRC2 dysfunction is associated with poor prognosis of breast cancer patients.
a, OncoPrint (cBioPortal) showing patients with loss of function mutations of PRC2 component genes in the TCGA breast cancer patient cohort. b, Kaplan-Meier survival (log rank Mantel-Cox test) of TCGA breast cancer patients with or without loss of function mutations of PRC2 component genes. c, OncoPrint (cBioPortal) showing patients with loss of function mutations of KMT2D-COMPASS component genes in TCGA breast patient cohort. d, Kaplan-Meier survival (log rank Mantel-Cox test) of TCGA breast cancer patients with or without loss of function mutations of KMT2D-COMPASS component genes. e, The EED-KO gene signature consisting PRC2 direct target genes that were uniquely up-regulated in C1-sgEED quasi-mesenchymal cell population. f,g, Kaplan-Meier survival (log rank Mantel-Cox test) of total (f) or ER-negative (g) breast cancer patients with high or low EED-KO signature scores.
To examine whether genes associated with the EED-KO quasi-mesenchymal cell state were predictive of clinical outcome, we established an EED-KO signature by assigning PRC2 direct target genes that were exclusively up-regulated in the EED-KO quasi-mesenchymal cell population (Fig. 5e). We then proceeded to analyze this signature using RNA-seq profiles of TCGA breast cancer patients. In this instance, we found that this signature was associated significantly with worse survival of breast cancer patients (log-rank test p = 0.0232, Hazard Ratio = 1.612) and this association was more readily apparent in estrogen receptor (ER)-negative patient cohort (log-rank test p = 0.0185, Hazard Ratio = 2.619) (Fig. 5f,g). Moreover, by analyzing scRNA-seq data of circulating tumor cells (CTCs) from breast cancer patients, we were able to identify a proportion of patient-derived CTCs that is associated with this EED-KO signature (Extended Data Fig. 7d). Taken together, these results are consistent with the elevated metastatic capability of EED-KO cells observed in our experimental model and indicate that genes associated with the metastasis-competent, quasi-mesenchymal state are operational in the tumors borne by human breast cancer patients.
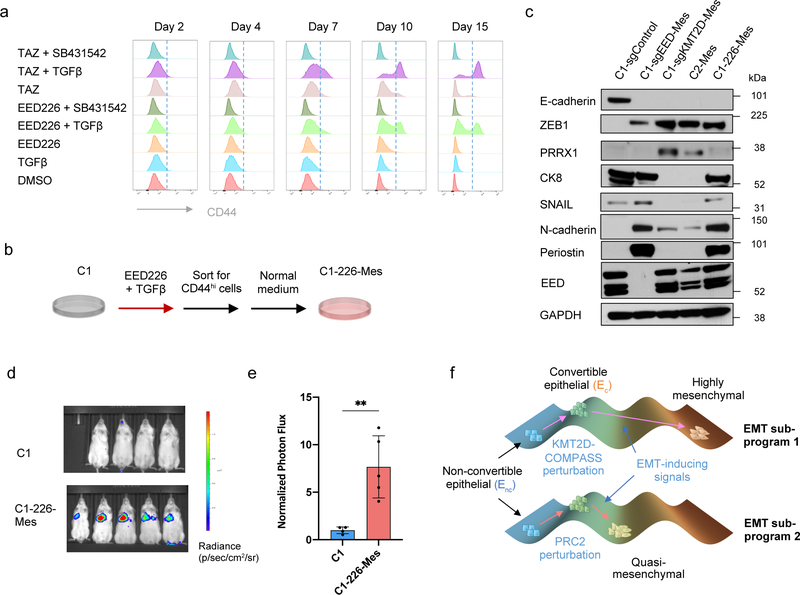
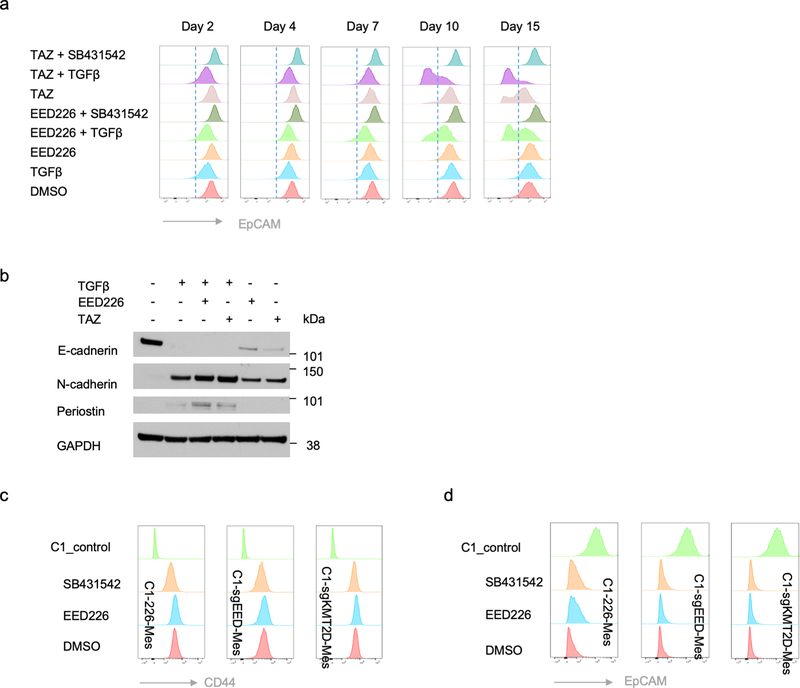
PRC2 pharmacological inhibitors are currently being evaluated clinically for a variety of cancer types. We therefore treated non-convertible C1 epithelial cells with two distinct PRC2 inhibitors, EED226 and Tazemetostat, to examine the influence of these inhibitors on EMP. Similar to the effects caused by EED knock-out, both of the PRC2 inhibitors were able to induce EMT in a TGF-β-dependent manner (Fig. 6a and Extended Data Fig. 8a). Elevated EMP was also observed when MCF10A immortalized human mammary epithelial cells were treated with these PRC2 pharmacologic inhibitors (Extended Data Fig. 8b).
Figure 6. Transient inhibition of PRC2 is sufficient to generate a metastatic, quasi-mesenchymal cell state.
a, Time-course flow cytometry analysis of the CD44 cell-surface staining of C1 cells treated with different combinations of TGF-β (2ng/ml), SB-431542 (5μM), EED226 (10μM) and Tazemetostat (TAZ) (10μM). b, C1–226-Mes cells were generated by treating C1 cells with EED226 and TGF-β for 10 days and then FACS-sorting the CD44hi population. c, Immunoblot of PRC2 component EED, EMT-TFs SNAIL, ZEB1, PRRX1 and EMT markers E-cadherin, Keratin 8, N-cadherin and Periostin in C1-sgControl, C1-sgEED-Mes, C1-sgKMT2D-Mes cells, C2-Mes and C1–226-Mes cells. n = 2 biologically independent experiments. d,e, Mice images (d) and quantification of bioluminescence (e) of mice intravenously injected with parental C1 or C1–226-Mes cells expressing luciferase reporter. Data were collected 14 days after cell injection. n=5. **, p = 0.005. Statistical analysis was performed using unpaired two-tailed Student t-tests. Data are presented as mean ± SEM. f, Schematic representation of the model in which loss of PRC2 and KMT2D-COMPASS enables EMP and specifies two EMT subprograms to generates distinct mesenchymal cell states. Numerical source data are provided.
We focused thereafter on the C1–226-Mes mesenchymal cells that were induced by exposure to EED226 and TGF-β treatment (Fig. 6b). C1–226-Mes cells persisted stably in a CD44hi, more mesenchymal state in vitro; removal of EED226 plus treatment with SB-431542 failed to force these cells to revert back to CD44lo epithelial state (Extended Data Fig. 8c,d). Hence, restoration of PRC2 function plus inactivation of autocrine TGF-β signaling following EMT does not suffice to trigger the reverse process – a mesenchymal-to-epithelial transition (MET).
Interestingly, C1–226-Mes cells, which were generated by transient pharmacologic inhibition of PRC2 function, entered and resided in a quasi-mesenchymal cell state that is similar to EED-KO quasi-mesenchymal cells (Fig. 6c). Importantly, C1–226-Mes cells were able to colonize the lung tissue when intravenously inoculated through the tail-vein (Fig. 6d,e). These data indicated that transient dysfunction of PRC2 complex is sufficient to enable EMP, permitting entrance into a quasi-mesenchymal cell state with an acquired elevated ability of metastatic colonization.
DISCUSSION
A major challenge to a resolution of the complexity of EMT programs derives from the current lack of a coherent understanding of the molecular and biochemical mechanisms that regulate EMP and specify different versions of EMT programs. In the present study, we identified two chromatin-regulatory complexes as important regulators of EMP through their ability to regulate two aspects of EMT activation (Fig. 6f). First, loss of either PRC2 or KMT2D-COMPASS sensitized initially stable epithelial cells to EMT-inducing signals, such as TGF-β, doing so by removing the binding of PRC2 from the promoters of key EMT-TF genes. Second, loss of PRC2 or KMT2D-COMPASS unlocks distinct EMT trajectories and yields two more-mesenchymal cell states with strongly differing metastatic abilities. EED-KO quasi-mesenchymal cells, but not parental epithelial cells or the KMT2D-KO highly mesenchymal cells, were able to form macrometastatic colonies in the lung, and genes linked with this specific quasi-mesenchymal cell state were associated with elevated stemness and poor prognosis of human breast cancer patients.
Interestingly, transient inhibition of PRC2 function suffices to destabilize ongoing residence in an existing epithelial state, yielding cells residing in a quasi-mesenchymal cell state similar to that generated by EED knock-out. In pathological conditions, the dysfunction of PRC2 might be induced continuously by genetic mutations or transiently by post-translational modifications of key PRC2 components such as EZH2 47. Indeed, an increase in the inactivating phosphorylation of EZH2 has been recently found to associate with a hybrid E/M state induced by FAT1 gene knock-out 48. As we have observed, restoration of PRC2 function by inhibitor withdrawn was insufficient to trigger MET in quasi-mesenchymal cells, which is likely caused by extensive transcriptional and epigenetic reprogramming that accompanies the process of EMT. It remains to be seen precisely how loss of PRC2 and KMT2D specifies these two distinct mesenchymal cell states and determines their different powers of metastatic colonization, as well as what additional factors could modulate the ability of PRC2 and KMT2D-COMPASS in regulating EMP.
At present, several PRC2 inhibitors are under active development as anti-neoplastic drugs 49. Although the levels of catalytic subunit of PRC2 complex, EZH2, have been reported to be elevated in breast carcinoma compared with normal breast epithelia 50, other studies found that increased EZH2 was merely a byproduct of increased cell proliferation, while impaired PRC2 function was seen to contribute to breast cancer tumorigenesis 51,52. The presently described data, taken together with several other reports 51,53,54, suggest that in certain biological contexts, perturbing PRC2 function, even transiently, confers risks of generating more aggressive neoplastic cells that display a cell-heritable, metastatic phenotypic state. These results therefore suggest that great caution should be applied to patient cohort selection and that careful monitoring of counterproductive side-effects should be an essential component of any related clinical trials.
METHODS
Study approval
Mice were housed and handled in accordance with protocol (1020–098-23) approved by the Animal Care and Use Committees of the Massachusetts Institute of Technology.
Cell culture and reagents
HMLE and HMLER cells were cultured in 2:1:1 MEGM (Lonza Bullet kit), DMEM and F12 media, supplemented with insulin (10 μg/ml), EGF (10 ng/ml), hydrocortisone (1 μg/ml), and 1x Pen/Strep (50 I.U./mL penicillin and 50 μg/mL streptomycin, Sigma-Aldrich #P4333). HCC827 cells were cultured in RPMI-1640 Medium, supplemented with 10% fetal bovine serum and Pen/Strep. MCF10A cells were cultured in DME+F12 (1:1) medium, supplemented with 5% Horse Serum, EGF (20ng/ml), Hydrocortisone (0.5 mg/ml), Cholera Toxin (100ng/ml), Insulin (10ug/ml) and Pen/Strep. SUM149 cells were cultured in F12 medium, supplemented with 5% fetal bovine serum (FBS), hydrocortisone (1ug/ml), insulin (5ug/ml), HEPES (10mM) and 1x Pen/Strep. Single-cell clones (SCCs) were sorted by FACS and then seeded into 96-well plates, with one single cell per each well. All cells were cultured in a 5% CO2 humidified incubator at 37 °C.
Plasmid constructs and virus construction
HMLE cells were previously generated 32. HMLER cells were generated by transforming HMLE cells with MSCV H-Ras V12 IRES GFP (Addgene #18780). pLenti-CRISPR-Cas9v2 (Addgene #52961) was used as backbone to generate constructs to knock-out specific genes. Spacer guide sequences used for the constructs are shown in Supplementary Table. MSCV H-Ras V12 IRES GFP was packged with pMD2.G (VSVG) (Addgene #12259) and pUMVC (Addgene #8449) plasmids. pLenti-based constructs were packaged with pMD2.G (VSVG) and psPAX2 (Addgene #12260) plasmids. For lentiviral infection, cells were seeded at 30% confluency in a 10-cm dish and transduced 24 h later with virus in the presence of 6 μg/ml protamine sulfate (Sigma-Aldrich, P4020). Cells were then selected by the relevant selection marker.
Animals and tumor cell implantation
All animal experiments were performed using NOD.Cg-Prkdcscid Il2rgtm1Wjl/SzJ (NSG, Jackson Laboratory) mice. Mice were 2–4 months of age at the time of injections. Animals were randomized by age and weight. Animals were housed in Whitehead Institute animal facility with 12 light/12 dark light cycle, 18–23°C temperature and 40–60% humidity. For orthotopic tumor transplantations, cells were resuspended in 20 μl of 50% Matrigel and injected into mammary fat pads of female NSG mice. The tumor incidence was measured 2–3 months after injection or when they reach 1 cm3 cumulative tumor size. For limiting dilution analyses, the frequency of cancer stem cells in the cell population that was transplanted was calculated using the Extreme Limiting Dilution Analysis Program (http://bioinf.wehi.edu.au/software/elda/index.html) 55. For tail-vein injection, 500,000 tumor cells were resuspended in 100 ul PBS, and injected into male animals. The lungs were examined 6 weeks post injection.
FACS analysis and sorting
Cells were prepared for sorting following trypsinization and quenching in DMEM supplemented with 10% Fetal Bovine Serum (FBS). Cells were then counted and washed with PBS−. For cells from xenograft tumors, tumors were taken from the animals aseptically. At least one fragment from each tumor was saved for histological staging of the tumor. The remainder of each tumor was then minced with a razor blade, and the minced chunks were then rinsed three times with PBS−, and digested with DMEM with 2 mg/mL collagenase and 100 U/mL hyaluronidase (Roche) in a rotator at 37 degree for 1 hour. The dissociated tumor cells were then washed twice with DMEM, and filtered through a 70 mm and 40 mm cell strainer to obtain single-cell suspensions. For FACS analysis, cells were resuspended in ice-cold PBS- at 1×10⁶ cells per 100 μl. FACS antibodies were added according to manufactures’ instruction, mixed gently and incubated in the dark on ice for a minimum of 30 minutes. Cells were washed twice using 2 ml PBS− and then resuspended in 500 μl PBS-. Cells were analyzed on a BD Biosciences FACSCanto II instrument. FACSDiva v8.0 software (BD) was used for data capture and FlowJo v10.7.1 (FlowJo, LLC) software was used for data analysis. FACS sorting was performed using the same protocol for cell preparation and then separated using a BD Biosciences FACSAria instrument with FACSDiva software. After sorting, cells were centrifuged and cultured in their respective medium.
Proliferation and tumorsphere assays
Proliferation assays were conducted in 6-well plates in indicated medium and manual counting of cells was performed after trypsinization at indicated time points. Cell counting was performed using Vi-CELL XR Cell Viability analyzer (Beckman Coulter). Tumorsphere assays were conducted using the MammoCult Medium Kit (Stemcell Technologies; 05620) supplemented with 4ug/ml heparin, 0.48ug/ml hydrocortisone, pen/strep, and 1% methylcellulose. 100 cells were seeded per replicate with 4 replicates per condition and spheres were counted on day ten.
Western blotting
Cells were washed in cold PBS and total protein was extracted in RIPA buffer (Invitrogen) supplemented with Phosphatase Inhibitors (PhosSTOPTM, Sigma-Aldrich # 4906837001) and Complete Protease Inhibitors (Roche) for 30 min on ice. All protein lysates were microfuged at 13,000 g for 30 min at 4°C before total protein concentration was determined by the BioRad protein quantification kit. Loading samples were then prepared and western blot performed according to manufacturer’s instructions (Thermo Fisher Scientific). Separation of total protein extracts was carried out in 1xMOPS buffer using NuPAGE Novex 4–12% Bis-Tris gels. Proteins were electro-transferred to PVDF membrane by wet blotting in NuPAGE Transfer buffer. Blocking and antibody incubations were performed following instructions for individual antibodies. Secondary antibodies (Cell Signaling Tech.) were used at 1:5,000 dilution detected with Pierce Femto or Dura ECL (Thermo Fisher Scientific) as substrate.
Immunofluorescence and histology analysis
Cultured cells were seeded on sterilized, round glass slides inside 10-cm petri dishes with cell culture medium. Once cells reached a sufficient density, glass slides were transferred into individual wells of 6-well dish and subsequent processing was done in this format at room temperature unless otherwise stated. Cells were fixed in 2.5% neutral buffered formalin on ice for 15 mins, followed by three washes in PBS. Cells were fixed in Triton-X100 for 3 mins and blocked in PBS containing 3% normal donkey serum. Cells were incubated with primary antibody at 4°C, overnight. Cells were washed three times with PBS− followed by incubation with secondary antibody 2 hrs. Cells were washed three times with PBS and incubated with DAPI for 10 mins, followed by 1 wash in PBS. Cells were mounted using Prolong gold antifade reagent.
Tumors were fixed in 10% neutral buffered formalin for overnight and transferred to 70% ethanol, followed by embedding and sectioning. Tumor sections were washed two times in Histoclear II, followed by one wash each in 100%, 95%, 75% ethanol, PBS and 1X wash buffer (Dako). Antigen retrieval was done in 1X Target Retrieval Solution, pH 6.1 (Dako) in a microwave. Sections were blocked in PBS containing 0.3% Triton-X100 and 1% normal donkey serum (Jackson ImmunoResearch Laboratories) for 1hr at room temperature. Sections were incubated with primary antibody at 4°C, overnight. Sections were washed two times in 1X wash buffer followed by incubation with secondary antibody (Biotium) for 2 hrs. Sections were washed three times with 1X wash buffer and incubated with DAPI for 10 mins, followed by 1 wash in PBS. Sections were mounted using Prolong gold antifade reagent (Invitrogen).
Immunostained samples were imaged and analyzed using Zeiss confocal microscope and analyzed using the Zen v2.0 software (Zeiss). Mouse lung tissues following cancer cell tail-vein injection were examined under Leica fluorescence dissecting microscope.
RNA-seq and single cell RNA-seq
For RNA sequencing, total RNA was isolated directly from cultured cells or sorted cells using Trizol (Invitrogen) and Direct-zol RNA miniprep kits (Zymo Research). Libraries were prepared using KAPA Biosystems KAPA mRNA HyperPrep Kit (Roche) following manufacturer’s directions. Sequencing was performed using Illumina HiSeq 2500 System (100×100 pair end, Illumina). RNASeq paired-end reads were aligned using STAR (v 2.7.1a) to the human genome (GRCh38) with Ensembl annotation v93 in gtf format. RNASeq quantification was performed using featureCounts 56, using the options -p and -s 2 for strandness, and normalized counts were obtained as implemented by DESeq2 57. The pheatmap, factoextra and clusterProfiler packages in R were used to plot graphs. GO enrichment analyses were performed using the PANTHER classification system (http://pantherdb.org) 58.
For single cell RNA-seq, libraries for isolated single cells were generated using 10X genomics Chromium Single Cell 3’ Library & Gel bead Kit V2 according to the manufacturer’s protocol. The resulting DNA library was double-size purified (0.6–0.8X) with SPRI beads and sequenced on an Illumina NextSeq using HO-SE75 kit or on HiSeq2 500 platform using PE50 kit. Cell-ranger v2.1.1 (10X genomics) was used to demultiplex all runs to FASTQ files, align reads to the GRCh38 human transcriptome and extract cell and UMI barcodes. For the experiment studying parental HMLER mixed with C1 and C2 clones, unique RNA barcodes were expressed in the cells before the experiment. Cell-ranger output counts were processed using the dropletUtils R package, for excluding chimeric reads, and identification and exclusion of empty cell droplets 59,60. For each single cell 10x channel, the number of unique molecular identifier (UMIs) associated with each of 3 unique experiment barcode tags was quantified. For the experiment studying cell state change after EED and KMT2D knock-out, C1-sgControl, C1-sgEED and C1-sgKMT2D cells were stained using anti-human Hashtag antibody associated with three distinct barcodes (BioLegend) before library preparation. Cellranger extracts and corrects the cell barcode from the Hashtag library at the same time generating gene expression reads. The Hashtag information was used to identify the cell identity for their corresponding gene knockout. UMAP dimensional reduction was performed using Seurat v3 61. 10x feature count matrix was imported into R followed by removal of negative and multiplet beads from data. Monocle 3 was used to perform the cell trajectory analysis 42.
CRISPR screening
In the genome-wide screen, C1 cells were transduced with a pooled genome-wide lentiviral sgRNA library in a Cas9-containing vector (Addgene #1000000100) at MOI < 1. Stably transduced cells were selected with 1 μg/ml puromycin, and 220 M (million) cells were passaged every 72 hours at a density of 5 M cells/15 cm dish for the duration of the screen. In order to enrich for mesenchymal cells that presumably account for very small population (we reasoned that very few genes would regulate the conversion to a more mesenchymal phenotype), two rounds of EpCAM-based magnetic-activated cell sorting (MACS) were performed at day 23 and day 30 in order to eliminate cells that retained a strong epithelial phenotype. Thereafter, a single round of CD44-based FACS sorting was performed at day 37 in order to positively select cells that had activated components of an EMT program. The final product was a cell population in which 87.9% cells showed a CD44hi mesenchymal phenotype at day 45.
In the EPIKOL screen, we used a similar screening strategy in which C1 cells were transduced with the EPIKOL library. Stably transduced cells were selected with 1 μg/ml puromycin, and 30 M cells were passaged every 72 hours at a density of 5 M cells/15 cm dish for the duration of the screen. A mesenchymal cell population was isolated following two rounds of EpCAM-based MACS sorting and one round of CD44-based FACS sorting. Slightly different from the initial genome-wide screening protocol, we added a TGF-β-exposed group in addition to the control group. The final product was a cell population in which 87.0% (control group) and 90.3% (TGF-β group) cells showed a CD44hi mesenchymal phenotype at day 45.
Genomic DNA was extracted using the QIAmp DNA Blood Miniprep kit from the following numbers of cells:
Screen 1 (Genome-wide): C1-library_Day 45: 10M; C1-FACS-CD44hi Mes: 5M.
Screen 2 (EPIKOL): C1_EPIKOL_Day 45: 20M; C1-EPIKOL-CD44hi Mes (Control): 8M; C1-EPIKOL-CD44hi Mes (TGF-β): 8M.
High-throughput sequencing libraries were prepared as in Ref 34, with the following exceptions:
Forward PCR primer (Screen 1): AATGATACGGCGACCACCGAGATCTACACGAATACTGCCATTTGTCTCAAGATCTA
Forward PCR primer (Screen 2): AATGATACGGCGACCACCGAGATCTACACCCCACTGACGGGCACCGGA
DNA Polymerase: ExTaq (Takara)
Genomic DNA/50 μL PCR reaction: 6 μg
Amplification cycles: 28
40 nucleotide reads were generated using the Illumina HiSeq. Sequencing reads were aligned to the sgRNA library and the abundance of each sgRNA was calculated. The counts from each population were normalized for sequencing depth after adding a pseudocount of one. The log2 fold change in representation of each sgRNA between the C1-FACS-CD44hi-Mes population and the C1-library_day_45 population (Screen 1) or between the C1-EPIKOL-CD44hi-Mes populations and the C1_EPIKOL_day 45 population (Screen 2) was calculated, and these fold changes were used to define an enrichment score for each gene. The log2 fold change in representation of all sgRNAs targeting a given gene was ranked from most positive to least positive, and the 2nd or 3rd most positive sgRNA was chosen as the enrichment score in first (genome-wide) and second (EPIKOL) screen respectively.
CUT&RUN
CUT&RUN experiments were carried out as described previously 40 with HMLER cell line-specific optimization steps. Briefly, epithelial fraction of C1-sgControl, C1-sgEED, C1-sgKMT2D and C2 cells were FACS sorted. Nuclei from 0.8–1.0 X 10⁶ cells were washed twice with wash buffer (20 mM HEPES, pH 7.5, 150 mM NaCl, 0.5 mM Spermidine, and complete protease EDTA-free tablets from Sigma, dissolved in DNase/RNase-free water), captured with BioMagPlus Concanavalin A (Polysciences, Cat # 86057–3) that had been activated immediately before by washing and resuspending in binding buffer (20mM HEPES-KOH, pH 7.9, 10mM KCl, 1mM CaCl2, 1mM MnCl2 dissolved in DNase/RNase-free water). Digitonin-wash buffer was prepared by mixing 5% digitonin (0.04% w/v final concentration) in previously made wash buffer. Captured cells were then incubated with primary antibodies for 2 hours at 4°C in antibody buffer (0.5M EDTA in digitonin-wash buffer). After washing away unbound antibody with digitonin-wash buffer, protein A-MNase was added at a final concentration of 700ng/ml and incubated for 1 hour at 4°C. The cells were washed again and placed on a 0°C metal block. Protein A-MNase was activated by adding 100mM CaCl2 to a final concentration of 2 mM. After 30 minutes of incubation on ice, this reaction was stopped by the addition of 2xSTOP buffer (200 mM NaCl, 20 mM EDTA, 4 mM EGTA, 0.1% digitonin (w/v), 50 mg/mL RNase A and 40 mg/mL glycogen, spiked with 20pg/ml yeast DNA, dissolved in DNase/RNase-free water). The protein-DNA complex was released by initially incubating tubes for 10 minutes at 37°C, followed by centrifugation at 16000g for 5 minutes at 4°C. The supernatant was collected and DNA was extracted using a PCR purification Kit (Machery Nagel, Cat # 740609) and eluted in a final volume of 40ul. (Protein A-MNase and yeast DNA were kindly provided by Dr. Steve Henikoff.)
Extracted DNA was quantified using Qubit fluorometer and quality assessed using bioanalyzer quality control. Libraries were prepared using Swift Science’s Accel-NGS Library Preparation Kit for Illumina Platforms according to manufacturer’s directions. The swift kit makes library from 10pg-100ng of double stranded input material. Briefly, the sample undergoes a series of incubations and purifications. The sample, through multiple incubations, repairs both 5’ and 3’ termini and sequentially attaches Illumina adapter sequences to the ends of fragmented dsDNA. The multiple bead-based clean-ups are used to remove oligonucleotides and small fragments, and to change enzymatic buffer composition between steps. The libraries were then sequenced using Illumina HiSeq 2500 System (40×40 pair end, Illumina). CUT&RUN paired-end reads were aligned to the human genome (GRCh38) using Bowtie2 (v 2.3.4.1) 62, with options -- very-sensitive and -- no-discordant. MACS2 (v 2.1.2) 63 was used to call peaks with options, -f BAMPE and --keep-dup 1. Peaks were associated to their closest gene(s) using bedtools’ closestBed 64 using Gencode v33 annotation. ngsplot was used to visualize profiles of the peaks in heatmaps 65. deepTools’ bamCoverage 66 was used to generate bigWig files; and Integrative Genomics Viewer 67 was used to visualize these files in a genome browser.
TCGA survival analysis
Survival analysis was performed to test the relationship between PRC2 component loss of function mutations or EED-KO signature and clinical outcomes of breast cancer patients. Clinical and normalized RNA-seq gene expression data for primary BRCA profiles as part of The Cancer Genome Atlas (TCGA) were obtained using Firehose (http://firebrowse.org/?cohort=BRCA). Mutation profiles of PRC2 component genes were obtained from cBioportal (https://www.cbioportal.org). For each patient from the TCGA dataset, EED-KO signature score was obtained by calculating the geometric mean of standard scores of the top 100 PRC2-regulated genes that were exclusively up-regulated in EED-KO quasi-mesenchymal cell state. To determine the optimal high/low cutoff to stratify patients, each EED-KO signature mean value was evaluated using the log-rank test p-value and hazard ratio as implemented in the survival package in R. Gene expression data of circulating tumor cells from breast cancer patients were from GSE111065 dataset. EED-KO signature was evaluated using AddModuleScore function in the Seurat package.
Statistics and reproducibility
All experiments were independently repeated at least twice with similar results, unless otherwise indicated in the figure legends. No statistical method was used to predetermine the sample size. No data were excluded from the analyses. For tumor staining sections, blinded evaluation was done by two scientists. Statistical analyses were performed using Prism v9.2.0. Data were presented as the mean ± SEM unless otherwise specified. Statistical tests were indicated in the corresponding figure legends. p < 0.05 was considered significant.
Data Availability
Bulk and single-cell RNA sequencing data and CUT&RUN data that support the findings of this study have been deposited in the Gene Expression Omnibus (GEO) under accession codes GSE158115. Human genome annotation data were obtained from Ensembl (https://useast.ensembl.org/Homo_sapiens/Info/Index). Clinical and normalized RNA-seq gene expression data for primary BRCA profiles as part of The Cancer Genome Atlas (TCGA) were obtained using Firehose (http://firebrowse.org/?cohort=BRCA). Mutation profiles of PRC2 and KMT2D-COMPASS component genes were obtained from cBioportal (https://www.cbioportal.org). Gene expression data of circulating tumor cells from breast cancer patients were from GSE111065 dataset. All other data supporting the findings of this study are available from the corresponding author on reasonable request.
Code Availability
All the code will be available on reasonable request, including but not limited to the following: scRNA-seq analysis, bulk RNA-seq analysis and CUT&RUN data analysis.
Extended Data
Extended Data Figure 1. HMLER epithelial cells show differential EMP which is associated with different TGF-β responses.
a,b, Flow cytometry of the CD44 and CD104 cell-surface staining of HMLER cells (a) and Bright-phase microscopy (b) of FACS-sorted CD44hi mesenchymal cells and CD44lo epithelial cells. Scale bar, 20 μm. n = 3 biologically independent experiments. c, Immunofluorescence staining shows adherent junction protein E-cadherin in FACS-sorted CD44hi mesenchymal cells and CD44lo epithelial cells. Scale bar, 20 μm. n = 2 biologically independent experiments. d, Flow cytometry of the CD44 and CD104 cell-surface staining using CD44lo epithelial population sorted from C1 and C2 cells. Data were collected at 1 and 5 days after sorting. e, UMAP plots showing expression levels of epithelial marker genes EPCAM, DSP and mesenchymal marker genes CDH2, ZEB1, ZEB2 and PRRX1 in HMLER/C1/C2 cells. f, mRNA expression levels of TGFB1, TGFBR2, TGFBR1, SMAD2, SMAD3 and SMAD4 in C1, and C2-Epi cells. n=3. n.s., not significant. g. ELISA assay shows TGF-β1 protein secreted by C1 and C2-Epi cells. n=3. **, p = 0.009. h, Immunoblot of phosphor-Smad2 and total Smad2 in C1 and C2-Epi cells, as well as C1 cells treated with DMSO or SB-431542 (5 μM). GAPDH as loading control. n = 2 biologically independent experiments. i, Normalized cell number of C1 and C2-Epi cells after five-day culture in control, TGF-β (2 ng/ml) and SB-431542 (5 μM) treated conditions. n=6. *, p = 0.03; ***, p < 0.001. j, Percentage of CD44hi mesenchymal population of C1 and C2-Epi cells after five-day culture in control, TGF-β (2 ng/ml) and SB-431542 (5 μM) treated conditions. n=3. ***, p < 0.001. Statistical analysis was performed using unpaired two-tailed Student t-tests (f,g) or one-way ANOVA followed by Tukey multiple-comparison analysis (i,j). Data are presented as mean ± SEM. Numerical source data are provided.
Extended Data Figure 2. CRISPR screening identifies EMP regulators.
a, Gating strategies used in FACS analysis and the CRISPR screens. One C2-Epi initiated primary tumor was used as an example. b, Flow cytometry of the CD44 and EpCAM cell-surface staining of HMLER cells, demonstrating CD44hi mesenchymal cell population does not express EpCAM. c, EpCAM-based magnetic-activated cell sorting (MACS) enriches CD44lo epithelial cells in MACS-EpCAMpos population and CD44hi mesenchymal cells in MACS-EpCAMneg population. d, A summary of EPIKOL sgRNA library content. e, Diagram of the EPIKOL CRISPR screening using nonconvertible C1 cells to identify possible regulators of E-M plasticity. f, List of significantly enriched GO cellular components terms from the EPIKOL CRISPR screening. Numerical source data are provided.
Extended Data Figure 3. PRC2 and KMT2D-COMPASS regulate EMP.
a, Sanger sequencing demonstrate complete knock-out of ASH2L, EED and KMT2D genes in the corresponding clonal cells. b, Percentage of CD44hi mesenchymal population in C1 cells transduced with sgRNAs targeting SETD1A, SETD1B, KMT2A, KMT2B, KMT2C and KMT2D respectively. n=3. ***, p<0.001. Statistical analysis was performed using one-way ANOVA followed by Dunnett multiple-comparison analysis. Data are presented as mean ± SEM. c, Flow cytometry analysis shows the CD44 and CD104 cell-surface staining of sorted epithelial subpopulation from C1-sgEED and C1-sgKMT2D cells (left) and the quantification of CD44hi mesenchymal population in different culture conditions (right). Cells were cultured in control (DMSO) or SB-431542 (5 μM) treated condition in vitro for 5 days. n=3. **, p = 0.001 (C1-sgEED-Epi), 0.007 (C1-sgKMT2D-Epi). Statistical analysis was performed using unpaired two-tailed Student t-tests. Data are presented as mean ± SEM. d, Flow cytometry of the CD44 cell-surface staining of C3-sgControl, C3-sgEED and C3-sgKMT2D cells at the population level. e, Flow cytometry of the EpCAM cell-surface staining of HCC827-sgControl, HCC827-sgEED and HCC827-sgKMT2D cells at the population level. f. Flow cytometry of cell-surface EpCAM in SUM149D2-sgControl, SUM149D2-sgEED and SUM149D2-sgKMT2D cells at the population level. g, Immortalized but not transformed HMLE epithelial cells contain convertible (nrc-4) and non-convertible (nrc-1) single cell clones. RAS transformation promotes EMT in convertible clone but not in non-convertible clone. h, Immunoblot of E-cadherin, N-cadherin, and ZEB1 in representative HMLE clones before and after RAS oncogene transformation. GAPDH as loading control. n = 2 biologically independent experiments. i, Flow cytometry of the CD44 and CD104 cell-surface staining of HMLE-nrc-1-sgControl, HMLE-nrc-1-sgEED and HMLE-nrc-1-sgKMT2D cells in control or TGF-β treated (2 ng/ml) conditions for 7 days. HMLE-nrc-1 is a clonal cell population generated from HMLE that stably reside in an epithelial state. Numerical source data are provided.
Extended Data Figure 4. PRC2 directly binds to the promoters of several EMT-TF genes and KMT2D-KO changes H3K27me3 genomic distribution.
a, Heatmap showing the global binding pattern of PRC2 (as measured by EZH2 CUT&RUN profiles) at promoter regions in C1-sgControl, C1-sgEED-Epi and C1-sgKMT2D-Epi cells. b, Immunoblot of H3K27me3 and H3K3me1/2/3 in C1-sgControl, C1-sgEED-Epi and C1-KMT2D-Epi cells. Total H3 as loading control. n = 2 biologically independent experiments. c, Majority of PRC2 direct target genes were up-regulated after EED knockout. d, Ectopic expression of EMT-TF ZEB1 is sufficient to activate an EMT program in C1 cells. e, Heatmap displaying the global COMPASS (as measured by ASH2L CUT&RUN profiles) occupancy in C1-sgControl, C1-sgEED-Epi, and C1-sgKMT2D-Epi cells. f, Heatmap showing mRNA expression levels of the 413 PRC2 direct genes. g, Heatmap showing all H3K27me3 peaks in C1-sgControl, C1-sgEED-Epi and C1-sgKMT2D-Epi cells. h, Average H3K27me3 signal of all H3K27me3 peaks in C1-sgControl, C1-sgEED-Epi and C1-sgKMT2D-Epi cells. i, Heatmap showing the top 2000 H3K27me3 peaks in C1-sgControl cells and the H3K27me3 signals in these same regions in C1-sgEED-Epi and C1-sgKMT2D-Epi cells. j, Average H3K27me3 signal of the top 2000 H3K27me3 peaks in C1-sgControl cells and average H3K27me3 signal in these regions in C1-sgEED-Epi and C1-sgKMT2D-Epi cells.
Extended Data Figure 5. EED-KO and KMT2D-KO generate distinct mesenchymal cell states.
a, UMAP plots showing expression levels of epithelial marker genes CDH1, EPCAM, DSP and mesenchymal marker genes ZEB1, ZEB2 and TWIST1 in C1-sgControl, C1-sgEED and C1-sgKMT2D cells. b, Immunoblot of EMT-TFs SNAIL, ZEB1, EMT marker genes E-cadherin, pan-cytokeratines and EED, KMT2D in SUM149D2-sgControl, SUM149D2-sgEED-Mes and SUM149D2-sgKMT2D-Mes cells. n = 2 biologically independent experiments.
Extended Data Figure 6. EED-KO quasi-mesenchymal cells show elevated ability in forming metastases.
a, Growth curve of C1-sgControl, C1-sgEED-Mes and C1-sgKMT2D-Mes cells in vitro. n=3. *, p = 0.03; **, p = 0.005. n.s., not significant.. b, Quantification of mammosphere formation by C1-sgControl, C1-sgEED-Mes and C1-sgKMT2D-Mes cells. n=3. ***, p<0.001. c, Differences in primary tumor-initiating ability of C1-sgControl, C1-sgEED-Mes and C1-sgKMT2D-Mes cells upon transplantation with limiting dilution into NSG mice. Tumors that arose from transplantation of 2 × 10⁶ cells were of similar size. n=5 in each group. d,e, Representative bright-phase and fluorescence microscopy (d) and number of metastatic nodules (e) shows metastatic outgrowths in the lung of C1-sgControl, C1-sgEED-Mes and C1-sgKMT2D-Mes cells 8 weeks after fat pad implantation. n=5 in each group. ***, p<0.001. n.s., not significant. Statistical analysis was performed using one-way ANOVA followed by Tukey multiple-comparison analysis. Data are presented as mean ± SEM. Numerical source data are provided.
Extended Data Figure 7. PRC2 loss of function mutations and the EED-KO gene signature associate with poor prognosis in breast cancer patients.
a, OncoPrint (cBioPortal) showing patients with loss of function mutations of PRC2 component genes in Metastatic Breast Cancer Project patient cohort. b, OncoPrint (cBioPortal) showing patients with amplification of PRC2 component genes in TCGA breast patient cohort. c, Kaplan-Meier survival (log rank Mantel-Cox test) of TCGA breast cancer patients with or without amplification of PRC2 component genes. d, A proportion of breast cancer patient-derived CTCs was associated with the EED-KO gene signature. scRNA-seq data were derived from GSE111065 dataset. Grey circles highlight CTCs associated with the EED-KO signature.
Extended Data Figure 8. PRC2 inhibitor treatment induces a metastatic, quasi-mesenchymal cell state.
a, Time-course flow cytometry analysis of the EpCAM cell-surface staining of C1 cells treated with different combinations of TGF-β (2ng/ml), SB-431542 (5μM), EED226 (10μM) and Tazemetostat (TAZ) (10μM). b, Immunoblot of E-cadherin, N-cadherin, Periostin in MCF10A cells treated with different combinations of TGF-β (2ng/ml), EED226 (10μM) and Tazemetostat (TAZ) (10μM) for 10 days. GAPDH as loading control. c,d, Flow cytometry analysis of the CD44 (c) and EpCAM (d) cell surface staining of C1 parental cells or C1–226-Mes, C1-sgEED-Mes and C1-sgKMT2D-Mes cells upon withdrawal of PRC2 inhibitors and addition of SB-431542 (5μM).
Supplementary Material
Acknowledgements
We thank Dr. Steve Henikoff for providing pA-MNase and yeast DNA for the CUT&RUN experiment. We are grateful to Dr. Richard Goldsby, Dr. Orit Rozenblatt-Rosen, Dr. George Bell and all members of the R.A.W. laboratory for discussion and suggestions. We thank the Flow Cytometry Core Facility, the Genome Technology Core, Bioinformatics and Research Computing Core at Whitehead Institute, and MIT Koch Institute Histology Facility for technical assistance. This research was supported by MIT Stem Cell Initiative, the Breast Cancer Research Foundation, the Advanced Medical Research Foundation, and the Ludwig Center for Molecular Oncology, National Cancer Institute Program R01-CA078461 (to R.A.W.), R35-CA220487 (to R.A.W.) and Susan G. Komen Postdoctoral Fellowship No. PDF15301255 (to Y.Z.). A.W.L was supported by an American Cancer Society – New England Division – Ellison Foundation Postdoctoral Fellowship (PF-15-131-01-CSM) and a postdoctoral fellowship from the Ludwig Center for Molecular Oncology at MIT. M.M.W. was supported by the David H. Koch Graduate Fellowship. T.B.O is funded by the Scientific and Technological Research Council of Turkey (TUBITAK#216S461). T.B.O, T.T.O. and N.A.L. are funded by Koç University Research Center for Translational Medicine (KUTTAM), funded by the Presidency of Strategy and Budget of Turkey. J.A.L. is the D. K. Ludwig Professor for cancer research. R.A.W. is an American Cancer Society research professor and a Daniel K. Ludwig Foundation cancer research professor.
Footnotes
Competing Interests
A.R. is a cofounder and equity holder of Celsius Therapeutics, an equity holder of Immunitas and was an SAB member of Neogene Therapeutics, Thermo Fisher Scientific, Asimov and Syros Pharmaceuticals until 31 July 2020. Since 1 August 2020, A.R. is an employee of Genentech, a member of the Roche group. R.A.W. has a consulting agreement with Verastem Inc together with holding shares of this company. No other authors declare competing interests.
REFERENCES:
- 1.Tirosh I et al. Dissecting the multicellular ecosystem of metastatic melanoma by single-cell RNA-seq. Science 352, 189–196 (2016). [DOI] [PMC free article] [PubMed] [Google Scholar]
- 2.Patel AP et al. Single-cell RNA-seq highlights intratumoral heterogeneity in primary glioblastoma. Science 344, 1396–1401 (2014). [DOI] [PMC free article] [PubMed] [Google Scholar]
- 3.Puram SV et al. Single-Cell Transcriptomic Analysis of Primary and Metastatic Tumor Ecosystems in Head and Neck Cancer. Cell 171, 1611.e1–1611.e24 (2017). [DOI] [PMC free article] [PubMed] [Google Scholar]
- 4.McGranahan N & Swanton C Clonal Heterogeneity and Tumor Evolution: Past, Present, and the Future. Cell 168, 613–628 (2017). [DOI] [PubMed] [Google Scholar]
- 5.Meacham CE & Morrison SJ Tumour heterogeneity and cancer cell plasticity. Nature 501, 328–337 (2013). [DOI] [PMC free article] [PubMed] [Google Scholar]
- 6.Flavahan WA, Gaskell E & Bernstein BE Epigenetic plasticity and the hallmarks of cancer. Science 357, eaal2380–10 (2017). [DOI] [PMC free article] [PubMed] [Google Scholar]
- 7.Nieto MA, Huang RY-J, Jackson RA & Thiery JP EMT: 2016. Cell 166, 21–45 (2016). [DOI] [PubMed] [Google Scholar]
- 8.Yang J et al. Guidelines and definitions for research on epithelial–mesenchymal transition. Nat Rev Mol Cell Biol 1–12 (2020) doi: 10.1038/s41580-020-0237-9. [DOI] [PMC free article] [PubMed] [Google Scholar]
- 9.Lambert AW, Pattabiraman DR & Weinberg RA Emerging Biological Principles of Metastasis. Cell 168, 670–691 (2017). [DOI] [PMC free article] [PubMed] [Google Scholar]
- 10.Aiello NM & Kang Y Context-dependent EMT programs in cancer metastasis. J Exp Med 216, 1016–1026 (2019). [DOI] [PMC free article] [PubMed] [Google Scholar]
- 11.Mani SA et al. The Epithelial-Mesenchymal Transition Generates Cells with Properties of Stem Cells. Cell 133, 704–715 (2008). [DOI] [PMC free article] [PubMed] [Google Scholar]
- 12.Lambert AW & Weinberg RA Linking EMT programmes to normal and neoplastic epithelial stem cells. Nature Reviews Cancer 128, 445–14 (2021). [DOI] [PubMed] [Google Scholar]
- 13.Singh A & Settleman J EMT, cancer stem cells and drug resistance: an emerging axis of evil in the war on cancer. Oncogene 29, 4741–4751 (2010). [DOI] [PMC free article] [PubMed] [Google Scholar]
- 14.Vega S et al. Snail blocks the cell cycle and confers resistance to cell death. Genes Dev 18, 1131–1143 (2004). [DOI] [PMC free article] [PubMed] [Google Scholar]
- 15.Saxena M, Stephens MA, Pathak H & Rangarajan A Transcription factors that mediate epithelial–mesenchymal transition lead to multidrug resistance by upregulating ABC transporters. Cell Death & Disease 2, e179–e179 (2011). [DOI] [PMC free article] [PubMed] [Google Scholar]
- 16.Dongre A et al. Epithelial-to-Mesenchymal Transition Contributes to Immunosuppression in Breast Carcinomas. Cancer Res 77, 3982–3989 (2017). [DOI] [PMC free article] [PubMed] [Google Scholar]
- 17.Kudo-Saito C, Shirako H, Takeuchi T & Kawakami Y Cancer metastasis is accelerated through immunosuppression during Snail-induced EMT of cancer cells. Cancer Cell 15, 195–206 (2009). [DOI] [PubMed] [Google Scholar]
- 18.Chen L et al. Metastasis is regulated via microRNA-200/ZEB1 axis control of tumour cell PD-L1 expression and intratumoral immunosuppression. Nature Communications 5, 1–12 (2014). [DOI] [PMC free article] [PubMed] [Google Scholar]
- 19.Pastushenko I et al. Identification of the tumour transition states occurring during EMT. Nature 556, 463–468 (2018). [DOI] [PubMed] [Google Scholar]
- 20.Jolly MK et al. Hybrid epithelial/mesenchymal phenotypes promote metastasis and therapy resistance across carcinomas. Pharmacol Ther 194, 161–184 (2019). [DOI] [PubMed] [Google Scholar]
- 21.Yuan S, Norgard RJ & Stanger BZ Cellular Plasticity in Cancer. Cancer Discovery 9, 837–851 (2019). [DOI] [PMC free article] [PubMed] [Google Scholar]
- 22.Fischer KR et al. Epithelial-to-mesenchymal transition is not required for lung metastasis but contributes to chemoresistance. Nature 527, 472–476 (2015). [DOI] [PMC free article] [PubMed] [Google Scholar]
- 23.Zheng X et al. Epithelial-to-mesenchymal transition is dispensable for metastasis but induces chemoresistance in pancreatic cancer. Nature 527, 525–530 (2015). [DOI] [PMC free article] [PubMed] [Google Scholar]
- 24.Ye X et al. Upholding a role for EMT in breast cancer metastasis. Nature 547, E1–E3 (2017). [DOI] [PMC free article] [PubMed] [Google Scholar]
- 25.Aiello NM et al. Upholding a role for EMT in pancreatic cancer metastasis. Nature 547, E7–E8 (2017). [DOI] [PMC free article] [PubMed] [Google Scholar]
- 26.Li Y et al. Genetic Fate Mapping of Transient Cell Fate Reveals N-Cadherin Activity and Function in Tumor Metastasis. Dev Cell 54, 593–607.e5 (2020). [DOI] [PubMed] [Google Scholar]
- 27.Bornes L et al. Fsp1-Mediated Lineage Tracing Fails to Detect the Majority of Disseminating Cells Undergoing EMT. CellReports 29, 2565–2569.e3 (2019). [DOI] [PMC free article] [PubMed] [Google Scholar]
- 28.Oft M et al. TGF-beta1 and Ha-Ras collaborate in modulating the phenotypic plasticity and invasiveness of epithelial tumor cells. Genes Dev 10, 2462–2477 (1996). [DOI] [PubMed] [Google Scholar]
- 29.Lamouille S, Xu J & Derynck R Molecular mechanisms of epithelial–mesenchymal transition. Nat Rev Mol Cell Biol 15, 178–196 (2014). [DOI] [PMC free article] [PubMed] [Google Scholar]
- 30.Latil M et al. Cell-Type-Specific Chromatin States Differentially Prime Squamous Cell Carcinoma Tumor-Initiating Cells for Epithelial to Mesenchymal Transition. Cell Stem cell 20, 191–204.e5 (2017). [DOI] [PMC free article] [PubMed] [Google Scholar]
- 31.Yuan S et al. Global Regulation of the Histone Mark H3K36me2 Underlies Epithelial Plasticity and Metastatic Progression. Cancer Discov 10, 854–871 (2020). [DOI] [PMC free article] [PubMed] [Google Scholar]
- 32.Elenbaas B et al. Human breast cancer cells generated by oncogenic transformation of primary mammary epithelial cells. Genes Dev 15, 50–65 (2001). [DOI] [PMC free article] [PubMed] [Google Scholar]
- 33.Chaffer CL et al. Normal and neoplastic nonstem cells can spontaneously convert to a stem-like state. PNAS 108, 7950–7955 (2011). [DOI] [PMC free article] [PubMed] [Google Scholar]
- 34.Wang T et al. Identification and characterization of essential genes in the human genome. Science 350, 1096–1101 (2015). [DOI] [PMC free article] [PubMed] [Google Scholar]
- 35.Yedier-Bayram O et al. EPIKOL, a chromatin-focused CRISPR/Cas9-based screening platform, to identify cancer-specific epigenetic vulnerabilities. Biorxiv 2021.05.14.444239 (2021) doi: 10.1101/2021.05.14.444239. [DOI] [PMC free article] [PubMed] [Google Scholar]
- 36.Meeks JJ & Shilatifard A Multiple Roles for the MLL/COMPASS Family in the Epigenetic Regulation of Gene Expression and in Cancer. Annu. Rev. Cancer Biol. 1, 425–446 (2017). [Google Scholar]
- 37.Margueron R & Reinberg D The Polycomb complex PRC2 and its mark in life. Nature 469, 343–349 (2011). [DOI] [PMC free article] [PubMed] [Google Scholar]
- 38.Piunti A & Shilatifard A Epigenetic balance of gene expression by Polycomb and COMPASS families. Science 352, aad9780–17 (2016). [DOI] [PubMed] [Google Scholar]
- 39.Dhar SS et al. MLL4 Is Required to Maintain Broad H3K4me3 Peaks and Super-Enhancers at Tumor Suppressor Genes. Mol Cell 70, 825–841.e6 (2018). [DOI] [PMC free article] [PubMed] [Google Scholar]
- 40.Skene PJ & Henikoff S An efficient targeted nuclease strategy for high-resolution mapping of DNA binding sites. Elife 6, 576 (2017). [DOI] [PMC free article] [PubMed] [Google Scholar]
- 41.Michalak EM et al. Canonical PRC2 function is essential for mammary gland development and affects chromatin compaction in mammary organoids. Plos Biol 16, e2004986–21 (2018). [DOI] [PMC free article] [PubMed] [Google Scholar]
- 42.Trapnell C et al. The dynamics and regulators of cell fate decisions are revealed by pseudotemporal ordering of single cells. Nature Biotechnology 32, 381–386 (2014). [DOI] [PMC free article] [PubMed] [Google Scholar]
- 43.Malanchi I et al. Interactions between cancer stem cells and their niche govern metastatic colonization. Nature 481, 85–89 (2011). [DOI] [PubMed] [Google Scholar]
- 44.Fazilaty H et al. A gene regulatory network to control EMT programs in development and disease. Nature Communications 1–16 (2019) doi: 10.1038/s41467-019-13091-8. [DOI] [PMC free article] [PubMed] [Google Scholar]
- 45.Ye X et al. Distinct EMT programs control normal mammary stem cells and tumour-initiating cells. Nature 525, 256–260 (2015). [DOI] [PMC free article] [PubMed] [Google Scholar]
- 46.Moody SE et al. The transcriptional repressor Snail promotes mammary tumor recurrence. Cancer Cell 8, 197–209 (2005). [DOI] [PubMed] [Google Scholar]
- 47.Göllner S et al. Loss of the histone methyltransferase EZH2 induces resistance to multiple drugs in acute myeloid leukemia. Nat Med 23, 69–78 (2017). [DOI] [PMC free article] [PubMed] [Google Scholar]
- 48.Pastushenko I et al. Fat1 deletion promotes hybrid EMT state, tumour stemness and metastasis. Nature 45, 253–8 (2020). [DOI] [PMC free article] [PubMed] [Google Scholar]
- 49.Comet I, Riising EM, Leblanc B & Helin K Maintaining cell identity: PRC2-mediated regulation of transcription and cancer. Nature Reviews Cancer 16, 803–810 (2016). [DOI] [PubMed] [Google Scholar]
- 50.Kleer CG et al. EZH2 is a marker of aggressive breast cancer and promotes neoplastic transformation of breast epithelial cells. Proc Natl Acad Sci USA 100, 11606–11611 (2003). [DOI] [PMC free article] [PubMed] [Google Scholar]
- 51.Wassef M et al. Impaired PRC2 activity promotes transcriptional instability and favors breast tumorigenesis. Genes Dev 29, 2547–2562 (2015). [DOI] [PMC free article] [PubMed] [Google Scholar]
- 52.Holm K et al. Global H3K27 trimethylation and EZH2 abundance in breast tumor subtypes. Molecular Oncology 6, 494–506 (2012). [DOI] [PMC free article] [PubMed] [Google Scholar]
- 53.Serresi M et al. Polycomb Repressive Complex 2 Is a Barrier to KRAS-Driven Inflammation and Epithelial-Mesenchymal Transition in Non-Small-Cell Lung Cancer. Cancer Cell 29, 17–31 (2016). [DOI] [PubMed] [Google Scholar]
- 54.Cardenas H, Zhao J, Vieth E, Nephew KP & Matei D EZH2 inhibition promotes epithelial-to-mesenchymal transition in ovarian cancer cells. Oncotarget 7, 84453–84467 (2016). [DOI] [PMC free article] [PubMed] [Google Scholar]
- 55.Hu Y & Smyth GK ELDA: extreme limiting dilution analysis for comparing depleted and enriched populations in stem cell and other assays. J. Immunol. Methods 347, 70–78 (2009). [DOI] [PubMed] [Google Scholar]
- 56.Liao Y, Smyth GK & Shi W featureCounts: an efficient general purpose program for assigning sequence reads to genomic features. Bioinformatics 30, 923–930 (2014). [DOI] [PubMed] [Google Scholar]
- 57.Love MI, Huber W & Anders S Moderated estimation of fold change and dispersion for RNA-seq data with DESeq2. Genome Biol. 15, 550 (2014). [DOI] [PMC free article] [PubMed] [Google Scholar]
- 58.Mi H, Muruganujan A, Casagrande JT & Thomas PD Large-scale gene function analysis with the PANTHER classification system. Nature Protocols 8, 1551–1566 (2013). [DOI] [PMC free article] [PubMed] [Google Scholar]
- 59.Griffiths JA, Richard AC, Bach K, Lun ATL & Marioni JC Detection and removal of barcode swapping in single-cell RNA-seq data. Nature Communications 9, 2667 (2018). [DOI] [PMC free article] [PubMed] [Google Scholar]
- 60.Lun ATL et al. EmptyDrops: distinguishing cells from empty droplets in droplet-based single-cell RNA sequencing data. Genome Biol. 20, 63 (2019). [DOI] [PMC free article] [PubMed] [Google Scholar]
- 61.Stuart T et al. Comprehensive Integration of Single-Cell Data. Cell 177, 1888–1902.e21 (2019). [DOI] [PMC free article] [PubMed] [Google Scholar]
- 62.Langmead B & Salzberg SL Fast gapped-read alignment with Bowtie 2. Nat Meth 9, 357–359 (2012). [DOI] [PMC free article] [PubMed] [Google Scholar]
- 63.Zhang Y et al. Model-based analysis of ChIP-Seq (MACS). Genome Biol. 9, R137–9 (2008). [DOI] [PMC free article] [PubMed] [Google Scholar]
- 64.Quinlan AR & Hall IM BEDTools: a flexible suite of utilities for comparing genomic features. Bioinformatics 26, 841–842 (2010). [DOI] [PMC free article] [PubMed] [Google Scholar]
- 65.Shen L, Shao N, Liu X & Nestler E ngs.plot: Quick mining and visualization of next-generation sequencing data by integrating genomic databases. BMC Genomics 15, 284 (2014). [DOI] [PMC free article] [PubMed] [Google Scholar]
- 66.Ramírez F et al. deepTools2: a next generation web server for deep-sequencing data analysis. Nucleic Acids Res 44, W160–5 (2016). [DOI] [PMC free article] [PubMed] [Google Scholar]
- 67.Robinson JT et al. Integrative genomics viewer. Nature Biotechnology 29, 24–26 (2011). [DOI] [PMC free article] [PubMed] [Google Scholar]
Associated Data
This section collects any data citations, data availability statements, or supplementary materials included in this article.
Supplementary Materials
Data Availability Statement
Bulk and single-cell RNA sequencing data and CUT&RUN data that support the findings of this study have been deposited in the Gene Expression Omnibus (GEO) under accession codes GSE158115. Human genome annotation data were obtained from Ensembl (https://useast.ensembl.org/Homo_sapiens/Info/Index). Clinical and normalized RNA-seq gene expression data for primary BRCA profiles as part of The Cancer Genome Atlas (TCGA) were obtained using Firehose (http://firebrowse.org/?cohort=BRCA). Mutation profiles of PRC2 and KMT2D-COMPASS component genes were obtained from cBioportal (https://www.cbioportal.org). Gene expression data of circulating tumor cells from breast cancer patients were from GSE111065 dataset. All other data supporting the findings of this study are available from the corresponding author on reasonable request.


