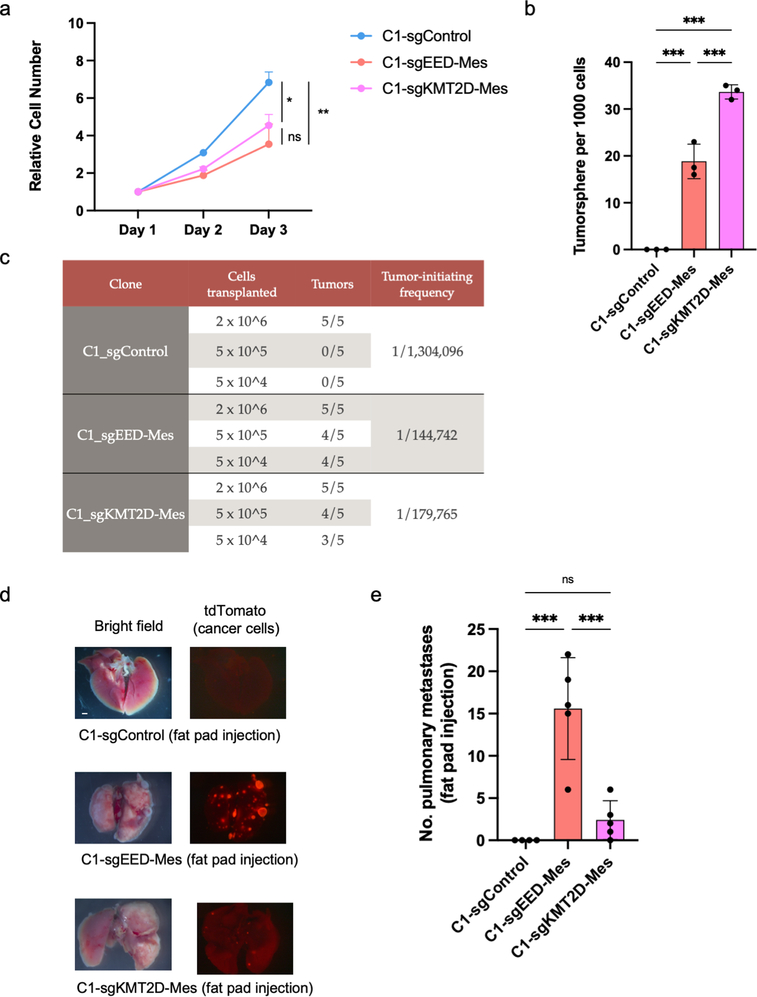
Extended Data Figure 6. EED-KO quasi-mesenchymal cells show elevated ability in forming metastases.
a, Growth curve of C1-sgControl, C1-sgEED-Mes and C1-sgKMT2D-Mes cells in vitro. n=3. *, p = 0.03; **, p = 0.005. n.s., not significant.. b, Quantification of mammosphere formation by C1-sgControl, C1-sgEED-Mes and C1-sgKMT2D-Mes cells. n=3. ***, p<0.001. c, Differences in primary tumor-initiating ability of C1-sgControl, C1-sgEED-Mes and C1-sgKMT2D-Mes cells upon transplantation with limiting dilution into NSG mice. Tumors that arose from transplantation of 2 × 10⁶ cells were of similar size. n=5 in each group. d,e, Representative bright-phase and fluorescence microscopy (d) and number of metastatic nodules (e) shows metastatic outgrowths in the lung of C1-sgControl, C1-sgEED-Mes and C1-sgKMT2D-Mes cells 8 weeks after fat pad implantation. n=5 in each group. ***, p<0.001. n.s., not significant. Statistical analysis was performed using one-way ANOVA followed by Tukey multiple-comparison analysis. Data are presented as mean ± SEM. Numerical source data are provided.

