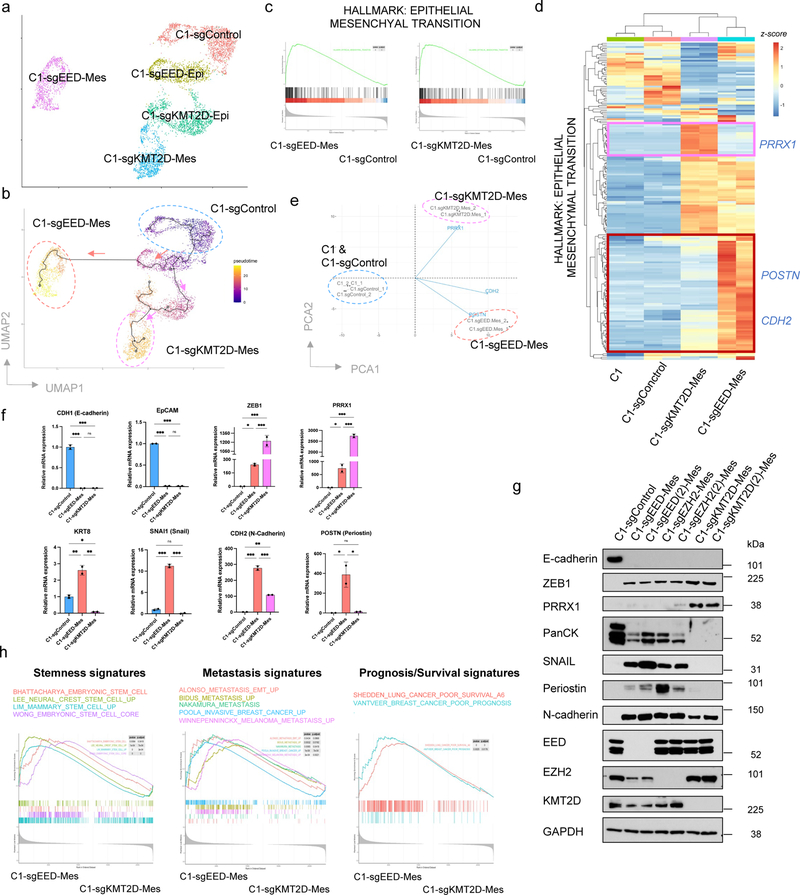
Figure 3. Knocking-out PRC2 or KMT2D-COMPASS generates two distinct (quasi-)mesenchymal cell states.
a, UMAP plot showing different clusters of C1-sgControl, C1-sgEED and C1-sgKMT2D cells. b, Cell trajectory analysis revealed knocking-out EED and KMT2D specified two distinct EMT subprograms. Colors represent pseudotime along the learned trajectories, rooted in epithelial C1-sgControl cells. c, GSEA analysis showing the Hallmark EMT gene set was enriched in both C1-sgEED-Mes and C1-sgKMT2D-Mes cells compared with C1-sgControl cells. d, Heatmap of RNA-seq data, showing expression patterns of genes within the Hallmark EMT gene set in parental C1, C1-sgControl C1-sgEED-Mes, and C1-sgKMT2D-Mes cells. e, PCA analysis of samples examined in panel d, using all the genes within the Hallmark EMT gene set. Three representative genes including PRRX1, CDH2 and POSTN were shown for their contribution to determine the PCA plot. f, mRNA levels of EMT-TF genes SNAI1, ZEB1, PRRX1 and EMT marker genes CDH1, EPCAM, KRT8, CDH2 and POSTN showed different expression patterns in C1-sgControl, C1-sgEED-Mes and C1-sgKMT2D-Mes cells. n=2. *, p < 0.05; **, p < 0.01; ***, p < 0.001. n.s., not significant. Statistical analysis was performed using one-way ANOVA followed by Tukey multiple-comparison analysis. Data are presented as mean ± SEM. g, Immunoblot of EMT-TFs SNAIL, ZEB1, PRRX1, EMT marker genes E-cadherin, pan-cytokeratines, N-cadherin and periostin and EED, EZH2, KMT2D in C1-sgControl, C1-sgEED-Mes, C1-sgEZH2-Mes and C1-sgKMT2D-Mes cells. C1-sgEED(2)-Mes, C1-sgEZH2(2)-Mes, C1-sgKMT2D(2)-Mes were generated using alternative guide RNAs targeting different genomic segments of their corresponding genes. n = 2 biologically independent experiments. h, GSEA analysis showing C1-sgEED-Mes cells were enriched for multiple transcriptional signatures associated with stemness, elevated metastasis and poor prognosis. Numerical source data are provided.

