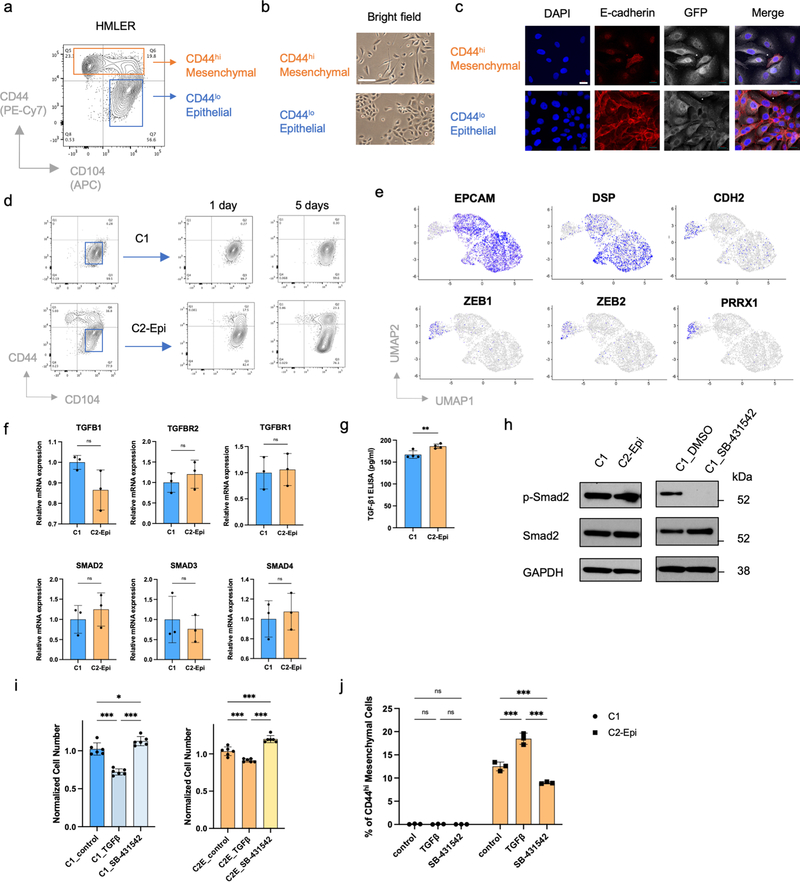
Extended Data Figure 1. HMLER epithelial cells show differential EMP which is associated with different TGF-β responses.
a,b, Flow cytometry of the CD44 and CD104 cell-surface staining of HMLER cells (a) and Bright-phase microscopy (b) of FACS-sorted CD44hi mesenchymal cells and CD44lo epithelial cells. Scale bar, 20 μm. n = 3 biologically independent experiments. c, Immunofluorescence staining shows adherent junction protein E-cadherin in FACS-sorted CD44hi mesenchymal cells and CD44lo epithelial cells. Scale bar, 20 μm. n = 2 biologically independent experiments. d, Flow cytometry of the CD44 and CD104 cell-surface staining using CD44lo epithelial population sorted from C1 and C2 cells. Data were collected at 1 and 5 days after sorting. e, UMAP plots showing expression levels of epithelial marker genes EPCAM, DSP and mesenchymal marker genes CDH2, ZEB1, ZEB2 and PRRX1 in HMLER/C1/C2 cells. f, mRNA expression levels of TGFB1, TGFBR2, TGFBR1, SMAD2, SMAD3 and SMAD4 in C1, and C2-Epi cells. n=3. n.s., not significant. g. ELISA assay shows TGF-β1 protein secreted by C1 and C2-Epi cells. n=3. **, p = 0.009. h, Immunoblot of phosphor-Smad2 and total Smad2 in C1 and C2-Epi cells, as well as C1 cells treated with DMSO or SB-431542 (5 μM). GAPDH as loading control. n = 2 biologically independent experiments. i, Normalized cell number of C1 and C2-Epi cells after five-day culture in control, TGF-β (2 ng/ml) and SB-431542 (5 μM) treated conditions. n=6. *, p = 0.03; ***, p < 0.001. j, Percentage of CD44hi mesenchymal population of C1 and C2-Epi cells after five-day culture in control, TGF-β (2 ng/ml) and SB-431542 (5 μM) treated conditions. n=3. ***, p < 0.001. Statistical analysis was performed using unpaired two-tailed Student t-tests (f,g) or one-way ANOVA followed by Tukey multiple-comparison analysis (i,j). Data are presented as mean ± SEM. Numerical source data are provided.

