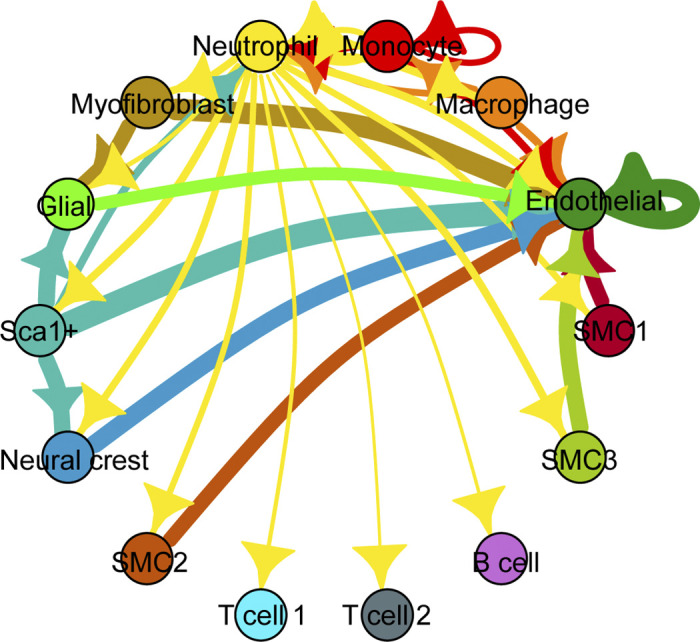
Figure 4.

Network diagram of significant cell-cell interactions via ligand-receptor pairs expressed in cell clusters (79) determined from previously published single-cell RNA-sequencing data of ElnSMKO ascending aorta (22). Arrows and color indicate direction (ligand to receptor) and thickness indicates the sum of the weighted paths between cell clusters.
