
FIGURE 1.
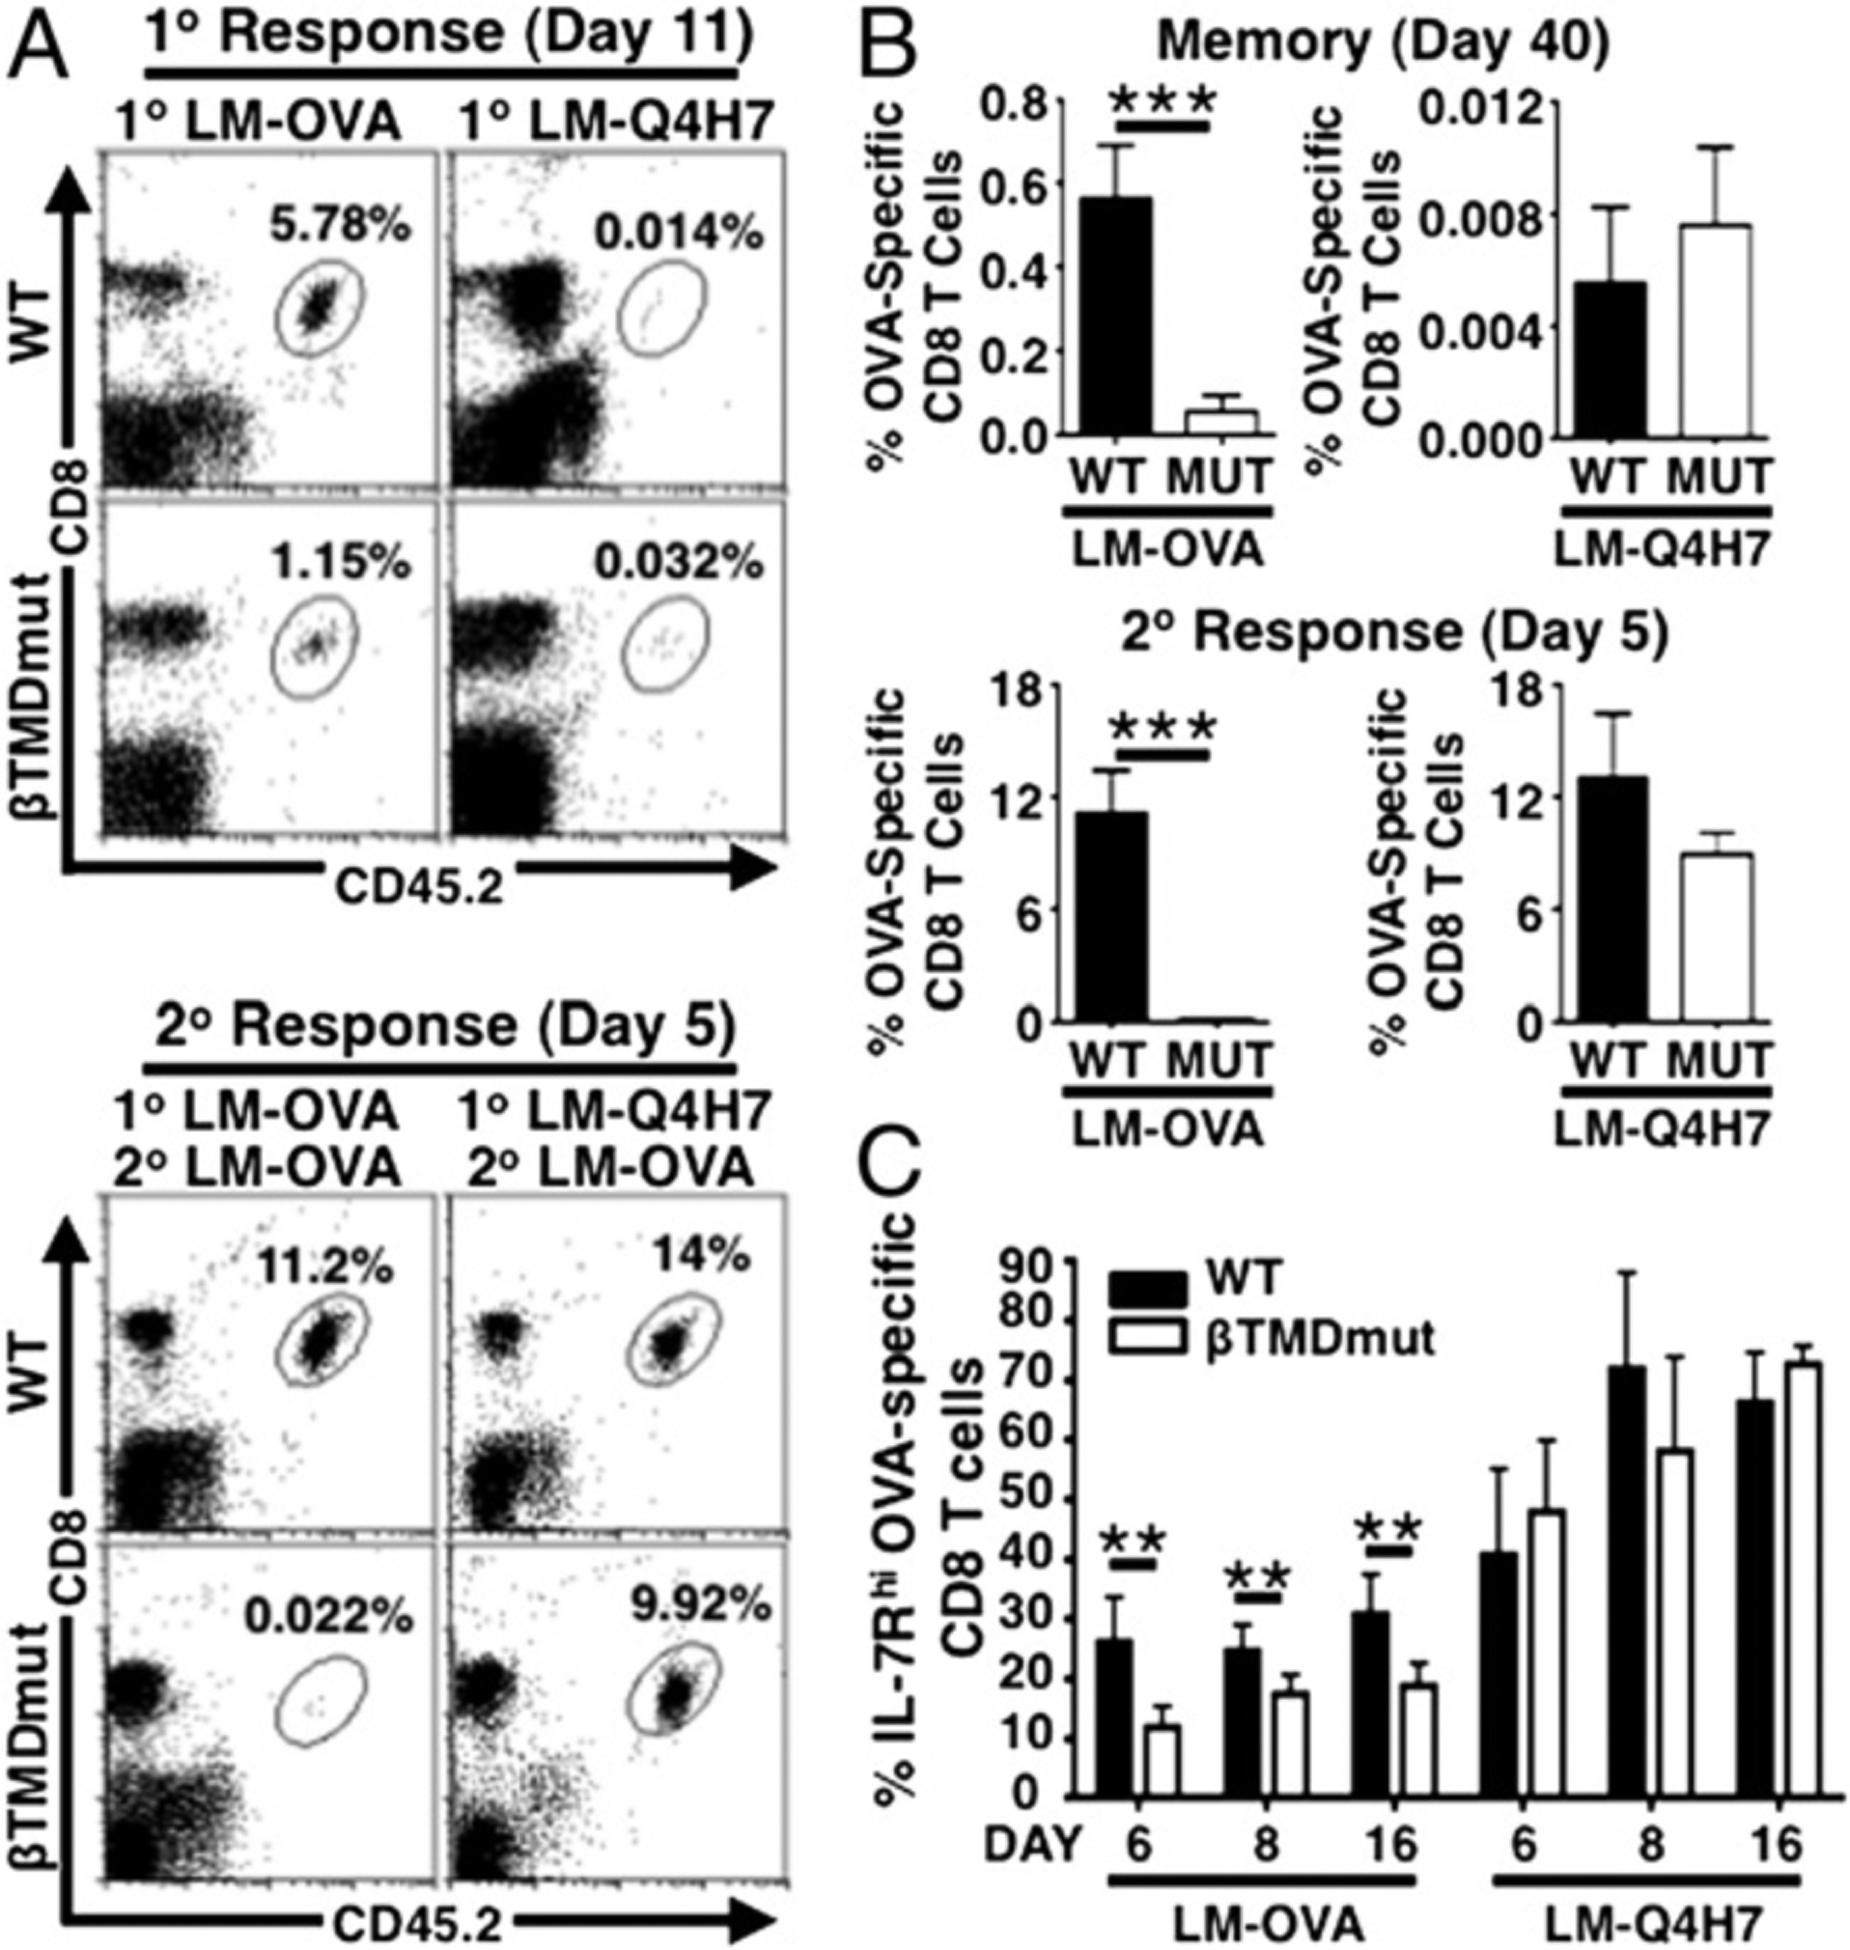
MUT memory defect is restored in response to low-affinity TCR ligands. (A and B) Naive T cells were transferred into B6.CD45.1+ hosts and challenged with 1 × 10³ CFU LM-OVA or LM-Q4H7. (A) Representative plots show frequencies of OVA-specific CD8 T cells in blood at day 11 of 1° response (upper panel) and day 5 of 2° response (lower panel). (B) Graphs show frequencies of OVA-specific cells in blood at day 40 of 1° response (upper panel) and day 5 of 2° response (lower panel, mean ± SD) in experiments analogous to (A). (C) Graph shows frequencies of IL-7Rhi cells in blood determined by flow cytometry (mean ± SD). Data are representative of n ≥ 3 independent experiments, n ≥ 3 mice per group. **p ≤ 0.005, ***p ≤ 0.001.