. 2021 Aug 12;11(44):27432–27442. doi: 10.1039/d1ra04543a

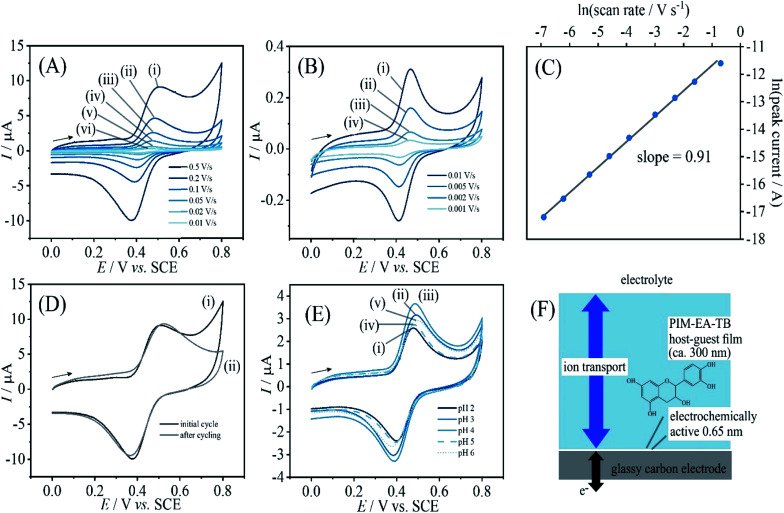
Fig. 2. (A) Cyclic voltammograms (3 mm diameter glassy carbon electrode; scan rate (i) 0.5, (ii) 0.2, (iii) 0.1, (iv) 0.05, (v) 0.02, and (vi) 0.01 V s−1) for catechin bound into a PIM-EA-TB film (immobilisation in 0.1 mM catechin in 0.1 M phosphate buffer pH 2 for 12 h) and immersed into 0.1 M phosphate buffer pH 2. (B) As before, for scan rates (i) 0.01, (ii) 0.005, (iii) 0.002, and (iv) 0.001 V s−1. (C) Double-logarithmic plot of anodic peak current versus scan rate. (D) As in A(i), for the initial potential cycle (i) and the final potential cycle (ii). (E) As in A(iii), comparing the effect of pH during immobilisation (F) Schematic illustrating the thin layer redox process.

Fig. 2