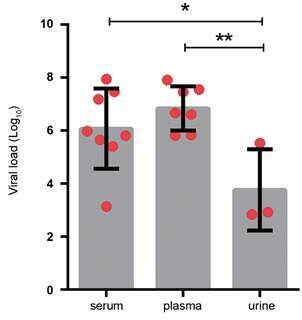
Fig. 1: Chikungunya virus (CHIKV) viral load comparison between blood (serum and plasma) and urine specimens in oncological patients (n = 9). Data are expressed as averages ± standard deviations (scatter plot with bar). Each dot (●) represents one positive patient. Statistical analyses were performed using One-way ANOVA with multiple comparisons using Tukey test, p values < 0.05 were considered significant. Asterisks indicate significant differences (p = 0.0121).

