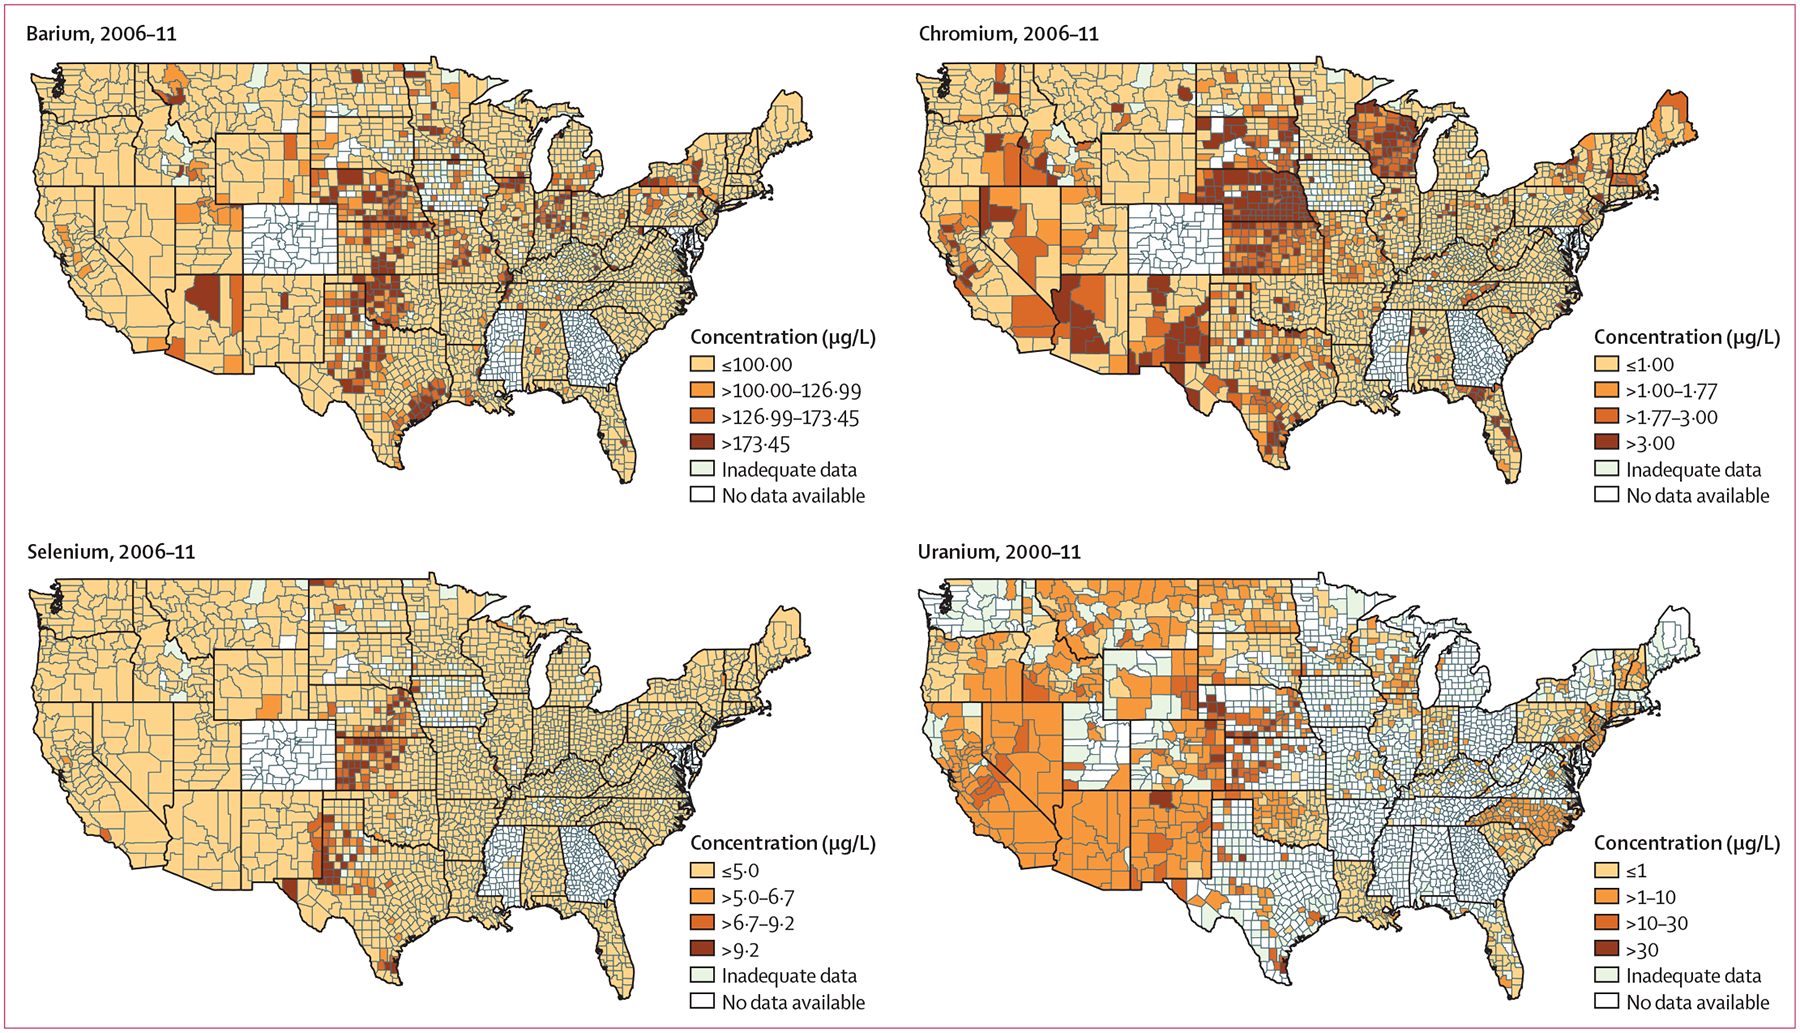
Figure 1: County-level weighted average of water contaminant concentrations in CWSs (n=37 915) from 2006–11 for barium (A), chromium (B), selenium (C), and uranium (D; 2000–11).

Average concentrations were weighted by the population served by each CWS to estimate the county-level weighted average CWS concentrations. Counties which were not represented by any CWSs in the SYR3 database are labelled as having no data available. Counties with inadequate data did not have CWS data representing at least 50% of the public water reliant population (appendix 2 pp 5–6). Estimates for uranium are derived from both the second (2000–05) and third (2006–11) SYR. For barium, chromium, and selenium, the lowest concentration category corresponds to less than or equal to the SYR3 minimum reporting level (100 μg/L for barium, 1 μg/L for chromium, 5 μg/L for selenium), and the other three categories reflect tertiles of the remaining distribution of county-level estimates. For uranium, the lowest concentration category corresponds to less than or equal to 1 μg/L, and the other three categories reflect cut-points that might be considered in future regulatory decisions. CWS=community water system. SYR=Six-Year Review.
