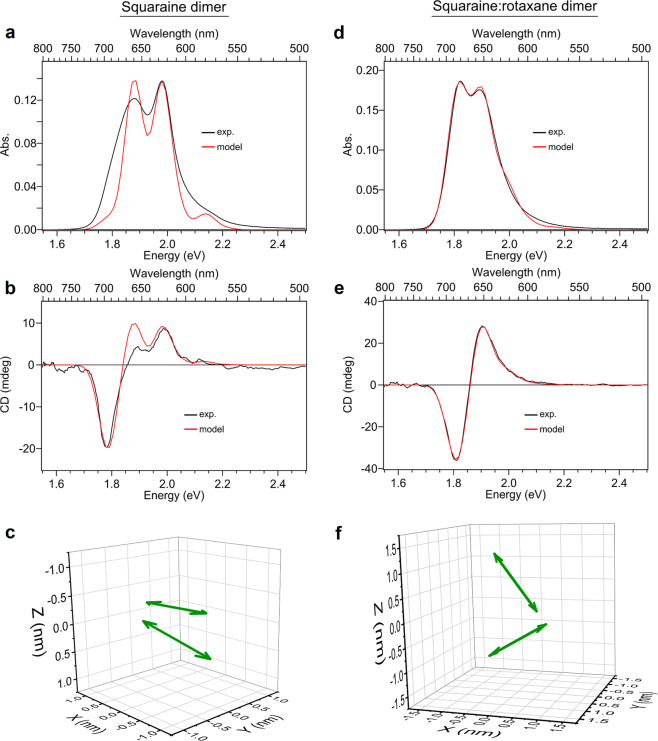
Fig. 3. KRM modeling of the dye packing in DNA-templated SQ and SR dimers.
a, d Experimental (black) and simulated (red) absorption spectra for the SQ and SR dimer solutions. b, e Experimental (black) and simulated (red) circular dichroism spectra for the SQ and SR dimer solutions. c, f Transition dipole moments (TDMs) derived from the KRM modeling of the absorption and CD spectra. The TDMs corresponding to the two dyes in the dimer structure are shown as double-headed, green arrows, which are assumed to orient along the long axis of the dye. Additional projections of the TDMs along the XY, XZ, and YZ planes are provided in Supplementary Note 4.

