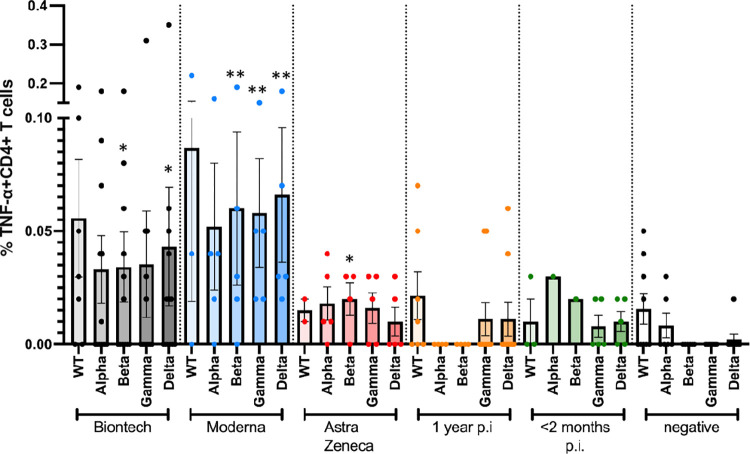
Fig 6. Antigen-specific TNF-α+ CD4+ T cell responses to JPT peptide S protein wt and mutant pools.
Antigen-specific CD4+ T cell responses elicited by the JPT peptide S protein pools after vaccination with BioNtech (grey), Moderna (blue) or AstraZeneca (red), or one year (orange) or < 2 months (dark green) after naturally occurring infection with SARS-CoV2, or negative controls. The bar graphs show frequencies of TNF-α+CD4+ T cells for wild type, and for alpha (B.1.1.7), beta (B.1.351), gamma (P.1) and delta (B.1.617.2) mutants. The figure shows results of n = 13 independent individuals after vaccination with BioNtech, n = 5 Moderna, n = 5 AstraZeneca, and n = 10 independent individuals one year and n = 7 < 2 months after natural infection with standard errors of the mean (SEM). Samples of non infected individuals tested negative (not shown in the figure to enhance legibility). At least 200,000 events were counted for each individual condition. Significance levels were tested by Kruskal-Wallis test for non-parametric values. *p < 0.05 vs. healthy controls, **p < 0.01 vs. healthy controls and also p < 0.05 vs. 1 year after infection.

