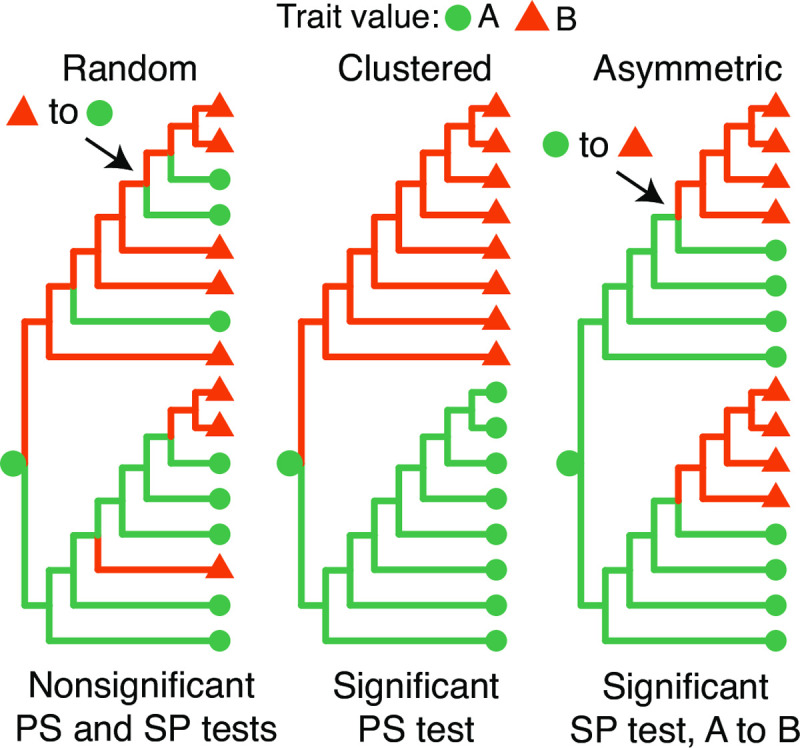
Fig 1. Hypothetical phylogenetic trees used to illustrate tree/trait association statistics.

Trait values at internal nodes of the tree are inferred using maximum parsimony given the trait values at the tips, which are shown using different colors and shapes. Two example state changes are highlighted. (left) No association between tip-trait values and tree: Distribution of traits across this tree is indistinguishable from randomly distributed traits by any statistic used. (middle) Tip-trait values clustered in tree: Cells with the same trait value are more closely related to each other in the tree, which will yield significantly fewer switches than in the same tree with permuted tips, and therefore a significantly low PS statistic. (right) Asymmetric ancestor/descendant relationships among trait values: All switches in this tree are from A to B (SP = 1), significantly higher than expected from the same tree with permuted tips. This indicates an asymmetric relationship between these states along the tree.
